
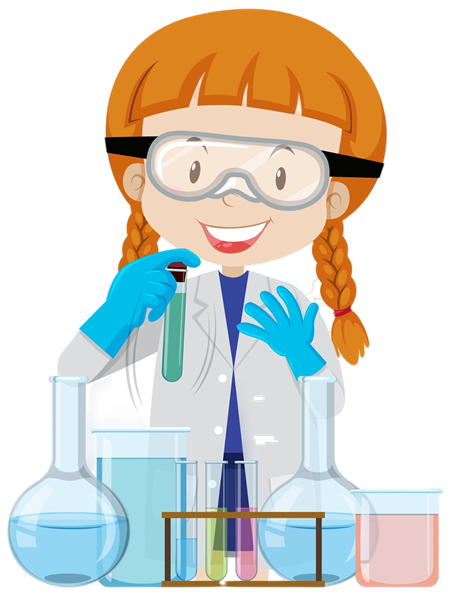
Lab Safety and Equipment Use
Scientific Method Puzzle – a simple crossword puzzle to practice vocabulary of the scientific method
Lab Safety Contract – students sign this contract after learning about lab safety
Measure a Bean – basic lab on measurements and collecting data
Tools and Measurements – how to use various tools in the lab, such as a graduated cylinder, ruler, and beaker
Using a Micropipette – activity explores how to use a micropipette to measure small volumes
Lab Safety Cartoon 🔥- a fun activity showing a cartoon of unsafe activities in the lab
The Elephant Poem – a poem about how observations depend on the perspective of the observer
Equipment Station Lab – a station lab activity where students move through stations and perform tasks with scientific equipment
Significant Figures – practice with significant figures and calculations
Reinforcement: Scientific Processes – vocabulary practice, match words to their descriptions (Key, TpT)
Stories and Scenarios
Variables with Simpsons 🔥- read stories involving characters from the Simpsons and determine the independent and dependent variables
Independent Variables – read a short sentence of science experiment and determine the variables
Beriberi and Penicillin – a short story on the discovery of penicillin and that Beriberi was caused by a vitamin deficiency
Discoveries in Science 🔥- focus on Pasteur’s experiment and other discoveries in science
The Martian and the Car – activity on life characteristics where students examine the traits of a car and determine if it is alive
Language of Science – focus on root terms to understand difficult scientific vocabulary
Logical Fallacies – activity on how reasoning works by focusing on specific logical fallacies
Units of Measurement – units matter! How many hands are on a horse?
Scientific Method Scenarios – activity where students are given a question and must design an experiment and identify variables
Asking Causal Questions – explore cause and effect with this flow chart experiment on water evaporation
 Hands-On Activities
Scientific Method Experiments – a collection of short inquiry labs the focus on consumer science. Students design and test their hypotheses
Fortune Telling Fish 🔥- Use the scientific method to determine what causes the fish the change when placed in the palm of the hand
Investigation: What Are the Processes of Science – students design an experiment about lung capacity; requires spirometers, AP Biology
Sponge Capsules – quick lab using capsules and water (toys) to collect data on how fast the “animals” grow
Investigation – Heat Storage and Loss – Use a jar and different types of insulation to explore how heat is lost and which materials are better insulators (Key, TpT)
Sponge Animals: Growing Insects – this lab grows sponge animals, graphs and calculates the growth rate (slope of line)
Plop Plop Fiz Fiz – measure the rate of dissolving in alka-seltzer tablets in both hot and cold water (a basic experiment for introducing the scientific method)
What Factors Affect How Quickly a Sweetart Dissolves – place candies in warm or cold water, add vinegar, etc.
Is Microwaved Water Harmful to Plants – use germinating seeds that have been soaked in distilled water and microwaved water
Water in Living Things – investigate how much water is stored in grass clippings
Gummi Bear Experiment – inquiry lab investigating the dissolving properties of gummi bears
Mystery Eggs – students use the scientific method to guess how many nails are hidden inside plastic eggs
Mystery Powder – containers with baking soda, corn starch, flour, sugar and salt. Students conduct tests to determine the contents.
Saving Sam 🔥- using paperclips rescue Sam, the gummy worm by putting a life preserver on him
Observation – opener lab, using the senses to investigate hardware items, then describe item
Pendulum Project – Inquiry based, experimental design and data analysis (physical science)
Penny Lab – conduct an experiment on surface tension, water drops are added to a penny and compared with soapy water
Properties of Water – Investigation exploring cohesion, adhesion, heat capacity, presented as lab station activities
Carbon Dioxide Production – determine how activity changes the amount of CO2 expelled in breath
Making Slime – instructions for creating a polymer with glue and borax
Measuring Lung Capacity – graphing and data gathering using balloons to measure vital capacity
What is the Effect of Exercise on Heart Rate – aligned to NGSS, feedback mechanisms and homeostasis. Students design and conduct an experiment.
Investigation: What Factors Effect the Heart Rate of Daphnia – expose a tiny crustacean to ethanol and gather data on its heart rate
Investigation: What Factors Affect Seed Germination – simple experiment where students use beans and different variables (water, light, temperature)
Lab – Identify Controls and Variables – station lab where students perform tasks, like measuring the absorbency of paper towels.
Can Crickets Tell the Temperature? – change the temperature and count the number of chirps (virtual lab)
Analyzing and Graphing Data
Analyzing Data – make and interpret graphs, summarize data trends
Graphing Data – Flow Rates – graph the flow rate of liquids in a pipe, simple plot and draw two lines
Graphing Practice – given data sets, such as video games scores and shirt colors, students create line and bar graphs, activity paired with growing sponge animals while students wait on results
Interpreting Graphs and English Usage – simple graph showing tadpoles, this is more of a vocabulary lesson on words used to interpret graphs, such as fluctuate, decline, stabilize…
Data Collection is Fun(gi) – use notes gathered in a field journal to create a data table to organize information about fungi and graph the relationship between fruiting body size and number.
Interpreting Graphs – shows a pie chart with grades, a scatter plot, and a few line graphs with questions to answer about each.
Microscope Use
How to Use a Microscope – basic guidelines, tips and troubleshooting for the classroom light microscope | Presentation
Label a Microscope – image of a basic classroom microscope for students to label parts
Microscope Coloring – learn the parts of the microscope by coloring
Microscope “E” Lab – use a microscope to examine the letter “e” and learn how to focus
Virtual Microscope Lab – uses an online virtual microscope, students can actually focus and adjust light using the simulator
Microscope Lab (advanced) – for AP Biology
Lab Reports
Scientific Method Flowchart– this flow chart can be used for any experimental design. Students organize their experiment, identify the controls and variables, collect data and draw conclusions.