Graphing Flow Rates in Pipes
Flow rate, in the context of pipes, refers to the volume of fluid (liquid or gas) that passes through a given cross-sectional area of a pipe per unit of time. It is typically measured in units like gallons per minute (GPM) or cubic meters per second (m³/s).
Several factors influence the flow rate in a pipe:
-
Pipe Diameter: The diameter of the pipe significantly affects the flow rate. Generally, a larger diameter allows for a greater volume of fluid to pass through, resulting in a higher flow rate.
-
Pressure Difference: Flow rate is also influenced by the pressure difference between the two ends of the pipe. This pressure difference, often referred to as the pressure gradient, drives the flow of fluid through the pipe.
-
Fluid Viscosity: The viscosity of the fluid being transported through the pipe affects the flow rate. Viscosity is a measure of a fluid's resistance to flow. Higher viscosity fluids flow more slowly than fluids with lower viscosity.
-
Pipe Length and Roughness: The length of the pipe and its surface roughness also impact flow rate. Longer pipes and pipes with rougher surfaces create more resistance to flow, which can reduce the flow rate.
-
Fluid Properties: The properties of the fluid itself, such as density and temperature, can affect flow rate.
Flow rate in a pipe can be calculated using various equations, with one of the most common being the Darcy-Weisbach equation for steady, incompressible flow:
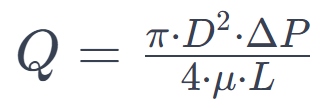
Where:
- is the flow rate (volume of fluid passing through the pipe per unit time)
- is the diameter of the pipe.
- Δ is the pressure difference between the two ends of the pipe.
- is the dynamic viscosity of the fluid.
- is the length of the pipe.
Flow Rate Data
Calculate the flow rate for each diameter of pipe. Round to the nearest decimal point.
| Diameter (cm) | Pressure Difference (psi) | Dynamic Viscosity | Pipe Length (m) | Flow Rate (GPM) |
|---|---|---|---|---|
| 1 | 1 | 1 | 2 | |
| 2 | 1 | 1 | 2 | |
| 3 | 1 | 1 | 2 | |
| 4 | 1 | 1 | 2 | |
| 5 | 1 | 1 | 2 |
Create a Graph
Graph the flow rates for each diameter. Use a LINE graph, with diameter on the X axis, and flow rate on the Y axis.