 Investigation: What Factors Affect the Heart Rate of Daphnia


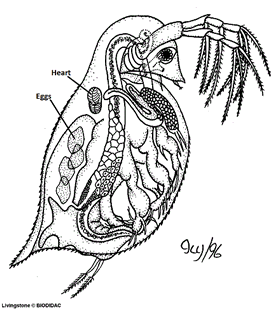
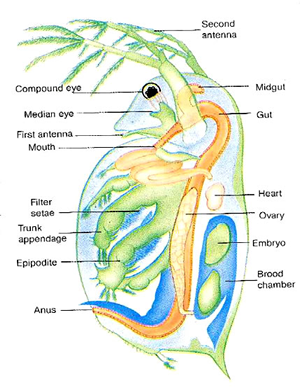
A Daphnia is a tiny crustacean (related to shrimp) that has a clear outside skeleton (carapace) and jointed legs. Like other arthropods, its heart is on its back.
Daphnia are ectothermic organisms. Ectotherms, also known as poikilotherms, are organisms whose internal body temperature is largely influenced by the external environment.
Daphnia, being small aquatic crustaceans, do not regulate their body temperature internally and instead depend on the temperature of the water they inhabit. Their metabolic processes and activity levels are influenced by the surrounding environmental conditions, including water temperature.
Chemicals which enter their bodies can also change their heart rate by interfering with the chemicals that nerves use to transmit signals. Chemicals that speed up heart rate are known as stimulants, whereas chemicals that slow down the heart rate are known as depressants.
Develop a hypothesis that predicts how the heart rate of the daphnia will change when it is exposed to a depressant. In this case, you will use a diluted solution of ethanol as the depressent.
MATERIALS
Daphnia in culture liquid | Transfer pipette / depression slide
Compound microscope or Stereoscope
A small container for “used” Daphnia as a recovery tank
1% ethanol in a dropper bottle *
PROCEDURE
Caution: Keep the light for your microscope OFF as much as possible to avoid overheating your Daphnia!
1. Take a small piece of cotton, tease it out and place it in the middle of a small Petri dish. (Alternatively, you can place the daphnia in a depression slide with enough water to cover the organism.)
2. Select a large Daphnia and use a pipette to transfer it onto the cotton wool fibres.
3. Immediately add pond water to the Petri dish until the animal is just covered by the water.
4. Place the Petri dish on the stage of a microscope and observe the animal under low power. The beating heart is located on the dorsal side just above the gut and in front of the brood pouch (see diagram). Make sure that you are counting the heart beats, and not the flapping of the gills or movements of the gut. The heart must be observed with transmitted light if it is to be properly visible.
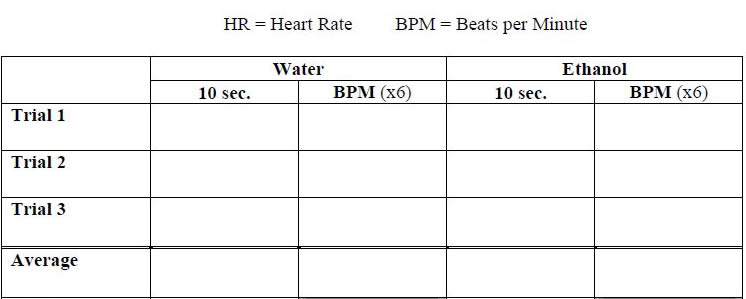
5. Use a stopwatch to time 20 seconds, and count the number of heart beats in several periods of 20 seconds. The heart beat of Daphnia is very rapid, so count the beats by making dots on a piece of paper in the shape of a letter S. Count the dots and express heart rate as number of beats per minute.
6. Take at least three separate heart rate measurements for each individual Daphnia and calculate the average of the three measurements.
7. When you have finished recording the heart rate in water (the CONTROL solution), add ONE DROP of the 1% ethanol solution to the slide. Turn the light OFF and wait 30 seconds.
8. Turn the light back on and count the number of heart beats for 10 seconds again, repeating at least 3 times. Multiply each count by 6 to get the heart rate per minute. Record in data table.
8. Rinse the Daphnia into the “used” container, then repeat steps # 3-9 with a new Daphnia.
Analysis and Conclusion
 Average BPM in Water: _________________
Average BPM in Ethanol: _______________________
1. Did the ethanol increase or decrease the heart rate?
2. Did the data support your hypothesis?
What was the independent (manipulated) variable in your experiment?
What was the dependent variable?
3. Would you classify the ethanol as a stimulant or a depressant? Why?
4. Compare your results with your lab partner. Did you get similar results? If no, propose an explanation for why your results might have been different.
Part 2: Design an Experiment
Now that you have an idea how to measure the heart rate of the daphnia, choose ONE new variable to test. Your instructor will provide you with additional materials. You can choose to test the effect of temperature or the effect of caffeine.
You will turn in a lab report that includes:
- Introduction which includes a hypothesis (or prediction)
- A summary or sketch of your experimental design
- Data table
- Summary / Conclusion that discusses the results of your experiment.