Students practice labeling organelles on a simple model (2D) and a more complex … Cell Labeling: Simple and Complex
Have you ever thought about how insects with 6 legs actually crawl? Human … Investigation: How Do Insects Move?
I give my students an elodea sprig with several leaves and have them … Anchoring Phenomenon and Osmosis
Most science classes begin the year with an exercise on the scientific method. … Penny Lab: Soap and Surface Tension
This graphic organizer (concept map) organizes the cell structures around the three main … Cell Structures: A Graphic Organizer
Students read short text passages and then color images to help them relate … Photosynthesis Coloring
Students label the image of a cell undergoing mitosis and answer questions about … Cell Cycle Labeling
This worksheet is used with a beginning anatomy unit that discusses anatomical terminology … Label the Body Regions
This activity asks students to calculate the population change (births - deaths) and … Deer: Predation or Starvation?
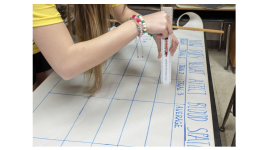
This exercise illustrates the difference between bar graphs and scatter plots and walks … Graphing Hand Span and Height
Students practice analyzing pie charts, scatter plots, and bar graphs in the basic … Interpreting Graphs
This activity was designed for anatomy and physiology students who are studying how … Investigation: How Does Exercise Affect Heart Rate
Graphic of the body systems where students fill in blanks about structures within … Body Systems Graphic Organizer
Examine urine samples from patients and suggest a diagnosis and treatment plan based … Urine Luck! – A Urinalysis Simulation
Students read text that describe the parts and functions of the microscope and … Color the Parts of a Microscope
This simple worksheet pairs with a lesson on the light microscope, where beginning … Microscope Labeling
Students analyze a community of beans (pinto, lima, navy) to determine the richness, … Measuring Biodiversity Using Beans
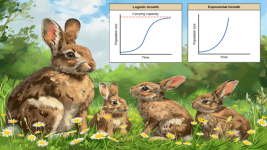
Students learn how the "mark and recapture" technique can be used to estimate … Estimating Population Size: A Netlogo Simulation
This activity asks students to sort seashells and calculate the Simpson's biodiversity index. … Biodiversity Index
Practice labeling the nephron with this reinforcement activity. Students can also color the … Color and Label the Nephron
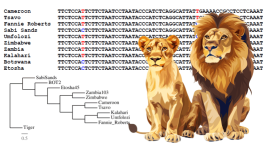
In order to convert my lectures to phenomenon-based lessons, I started the community … Niche Partitioning – Gorongosa Phenomenon
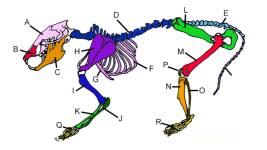
In this activity, students use string to model the gastrointestinal tract as a … Modeling the Alimentary Canal
This procedural lab is a great compliment for genetic studies where students learn … Investigation: Gel Electrophoresis
Based on the Berkeley website: Understanding Evolution, this version focuses on the how … Case Study: How Do Tibetans Survive High Altitudes
This activity is designed to help students examine scatter plots that show phenotype … Data Analysis: Virginia Opossum
This activity was modified from HHMI’s “Modeling the Regulatory Switches of the Pitx1 … Investigation: Gene Switches in Stickleback Fish
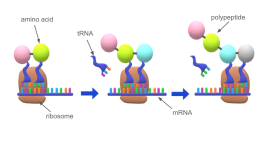
In this activity, students use a codon chart to compare the DNA sequence … DNA, Proteins, and Sickle Cell
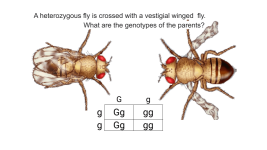
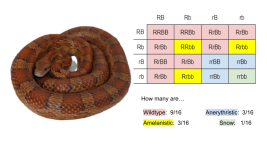
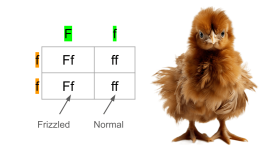
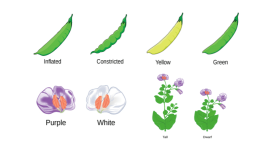
Beginning biology students can really struggle with dihybrid crosses and setting up Punnet … Genetic Crosses with 2 Traits
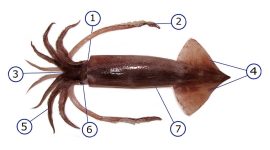
Many of us may have used virtual dissection platforms to supplement classroom activities … What Happened to Virtual Dissections?