
In this exercise, students examine several graphs and graphics related to mitosis and cancer. For each image, students work together to complete a Claim, Evidence, and Reasoning chart.
In the final step, students compile all of the evidence to answer the overall question: “How Are Cancer Cells Different from Normal Cells?”
The activity uses Google slides to display data the data students interpret. The slides can be printed, or students can work on Chromebooks. There are five different graphs, so each group of 4 can have a unique data set to interpret.
Slides Summary
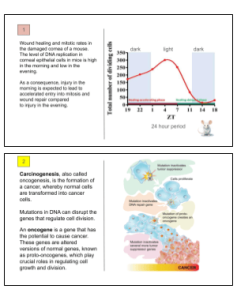
- Shows a graph of number of dividing cells over a 24 hour period. The number of dividing cells is greatest during daylight hours.
- Graphic shows carcinogenesis in cancer cells. Steps include mutation of DNA repair genes and inactivation of tumor suppressor genes.
- A bar chart shows the differences between normal cells and cancer cells with regard to time spent in each phase. Cancer cells spend more time in G2/M phase.
- Shows an image of a malignant tumor and its interaction with a blood vessel. Tumors promote angiogenesis.
- A microscopic sketch showing differences between normal and cancer cells. Cancer cells are multinucleated and have small amounts of cytoplasm.
Classroom Resources
I use this activity with the unit on cell division, mitosis, and cancer.
- Mitosis Google Slides with Guided Notes
- Hayflick Limit CER – exploring cell senescence
- Cell Cycle Labeling – label the phases of the cell cycle, and cell structures associated with cell division
- Investigation: Mitosis and Cancer – use slides of onion roots to estimate time spent in each phase