
Tag: data
-

Case Study – Effects of Coyote Removal in Texas
Examine data from an experiment where coyotes were removed from test sites. Evaluate the effects on rodents and mesopredators.
-

Mitosis and Cancer – Data Analysis on Carcinogenesis
A group activity where students analyze images and charts to determine the relationship between mitosis and cancer.
-
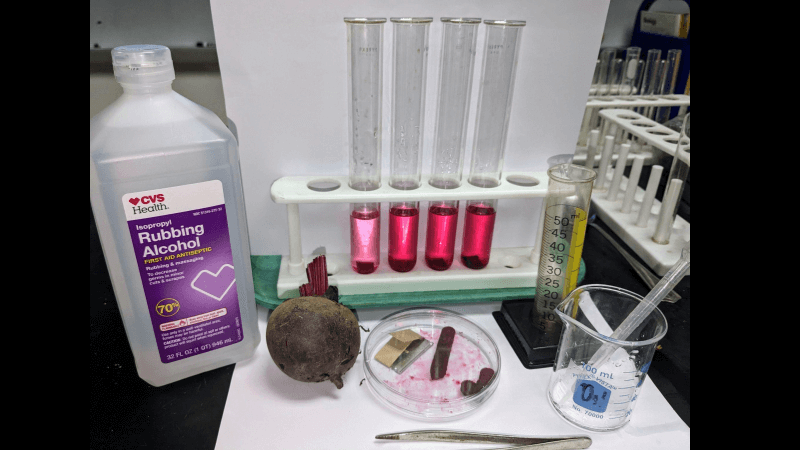
Use Beets to Explore Membrane Permeability
Students test the effects of pollution on membrane permeability using beetroot cores.
-
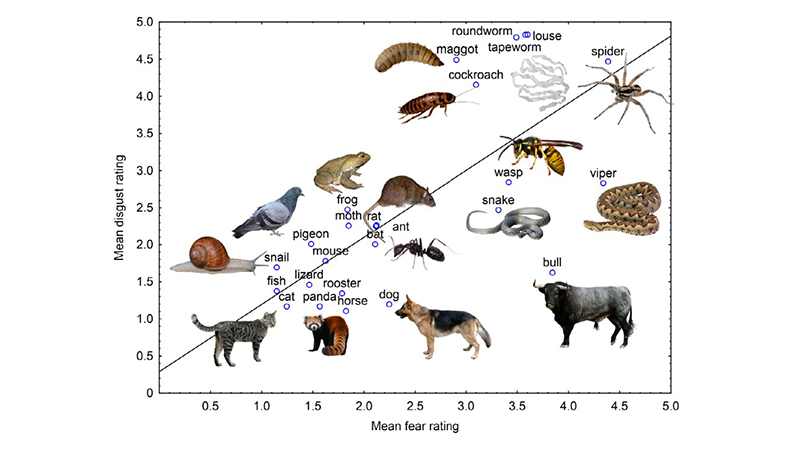
Spooky Science – Data Analysis on Fear and Disgust
Students explore what animals elicit feelings of disgust or fear. They analyze a graph and suggest evolutionary reasons for fear.
-
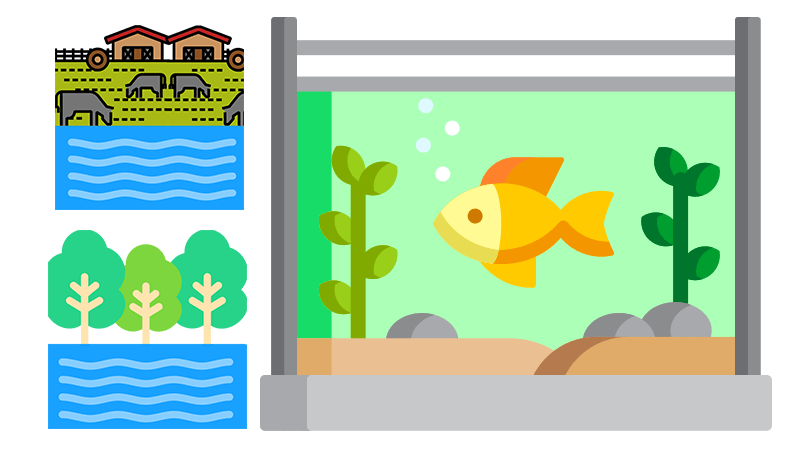
What Causes Algae Growth in Ponds?
Students examine data on two ponds to determine what is causing the algae growth in the pond near a farm.
-

Analyze Data and Create a Climate Graph
Students practice analyzing climate graphs of four regions in the United States. Answer simple questions and create a graph from data collected in Germany.
-
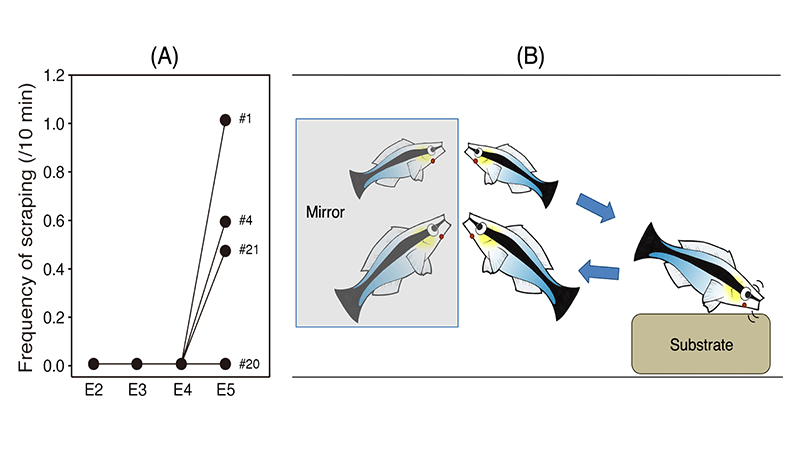
Can Fish Recognize Themselves in a Mirror (CER)
Examine data that supports the claim that fish exhibit self awareness. Fish scrape their bodies on substrate when they see a mark on themselves in the mirror.
-
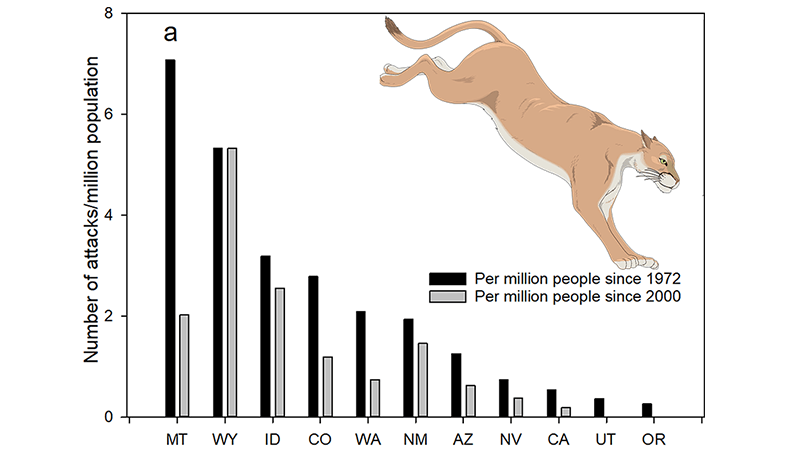
Can Sport Hunting Control Predator Populations?
Examine data that compares states that allow trophy hunting of pumas to California which does not allow hunting.
-
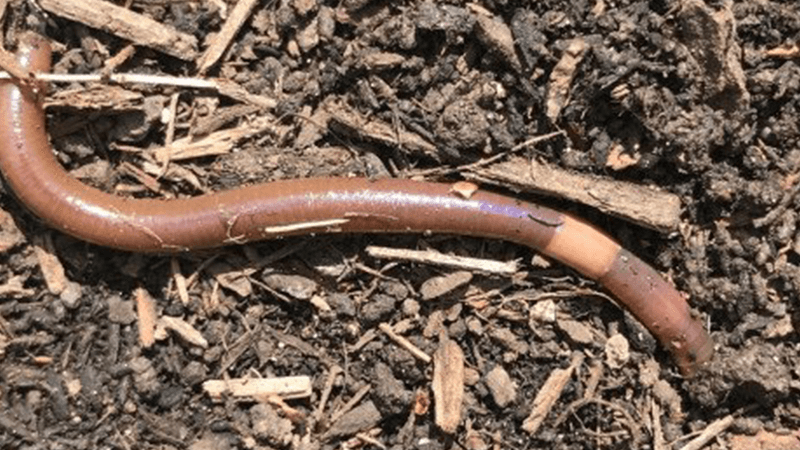
Data Analysis – Invasion of the Jumping Worms
Lesson plan uses the 5E model to explore the invasive Asian Jumping Worm and its impact on soil and forests; includes data analysis.
-
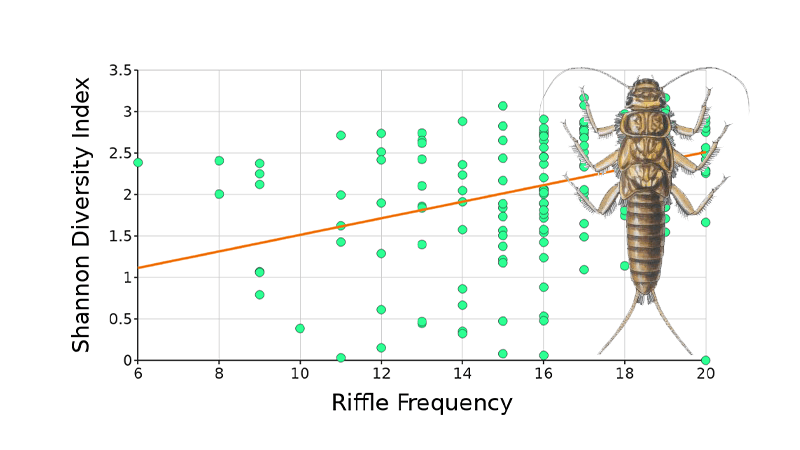
Measuring Water Quality with Biodiversity
Students manipulate data to show how water quality and stream diversity are connected. Dataclassroom is used to analyze data sets and complete a CER.
-
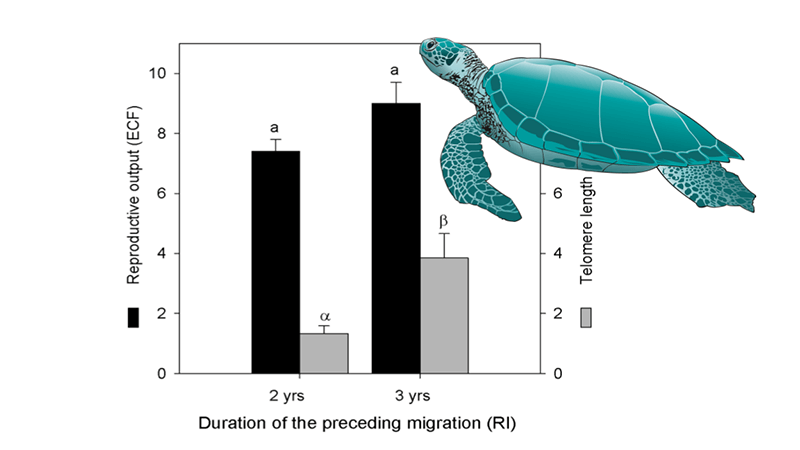
Analyzing a Turtle Graph from Primary Source
Examine data on turtle reproduction and migration. Annotate graphs and develop a claim; use reasoning to support that claim with data.
-
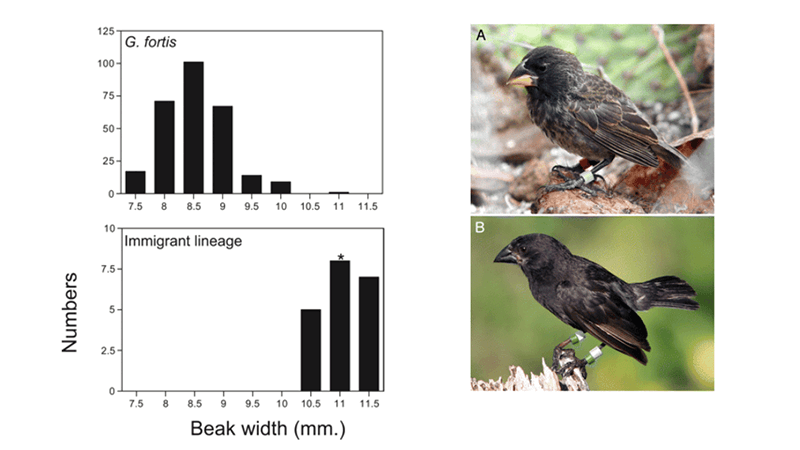
Speciation on Daphne Major – Big Birds Get No Love
The beaks of finches on the island changed in size after a catastrophic draught. Students analyze graphs and explore how natural selection affects populations.
-
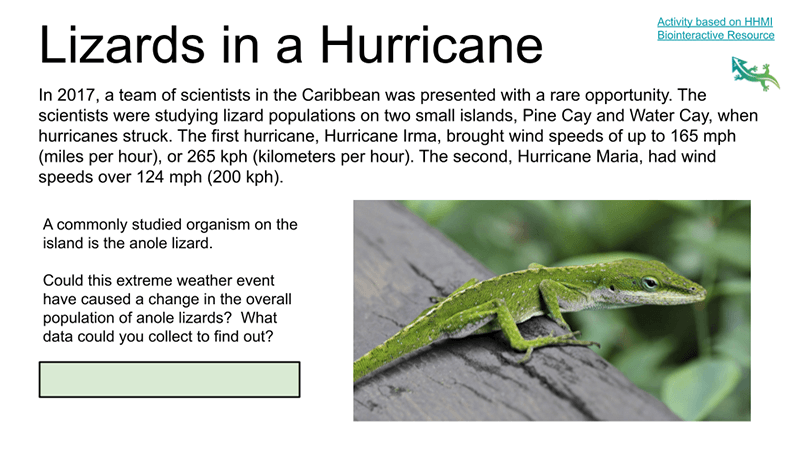
Data Analysis – Lizards in a Hurricane
Students examine images showing how lizards hang on to a branch during high winds. Data shows that some anoles have larger toe pads
-
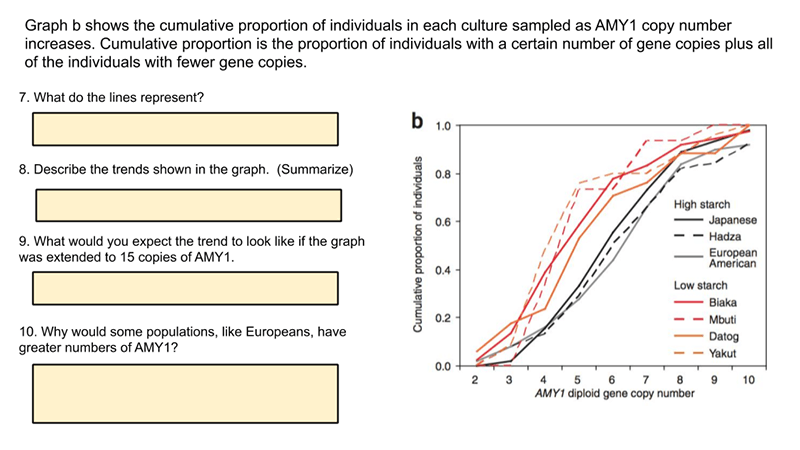
Amylase Enzyme and Copy Number Variant
This activity explores a data set on the frequency of copy number variants in the gene AMY1 that codes for amylase activity in the saliva. Amylase is an enzyme that breaks down starch into sugar. The activity builds on the HHMI data point showing how presence of multiple copies of the gene correlate to populations…
-
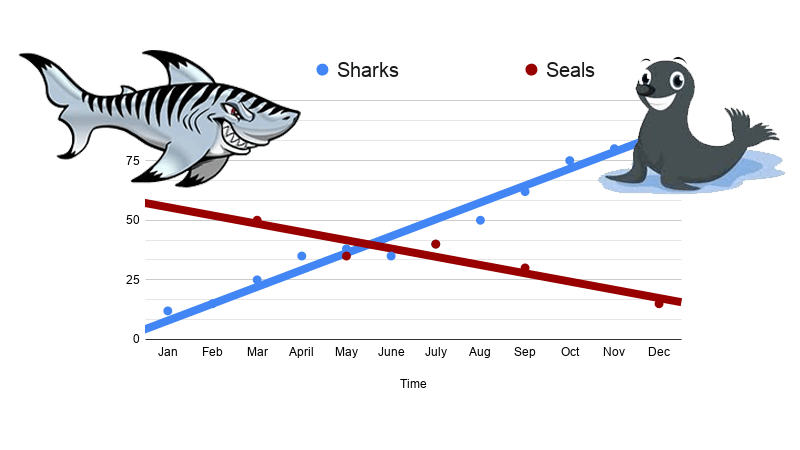
CER – Data Analysis with Sharks
Shark data by month where students make a LINE graph to show how the population changes over time. Students complete a CER to discuss results.