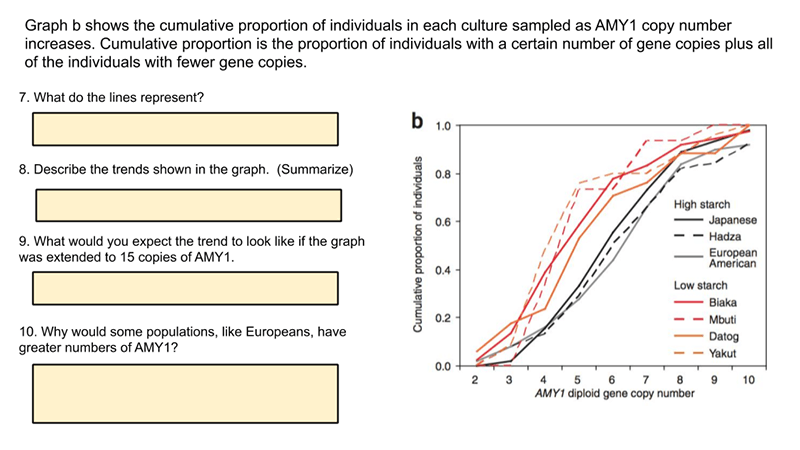
This activity explores a data set on the frequency of copy number variants in the gene AMY1 that codes for amylase activity in the saliva. Amylase is an enzyme that breaks down starch into sugar. The activity builds on the HHMI data point showing how presence of multiple copies of the gene correlate to populations who had high starch diets.
Students progress through slides that explain copy number variants. Then they analyze data and draw conclusions from the graphs and information.
In the final section, students view data on dogs and the same gene that codes for amylase, where they can draw conclusions about why some dogs have more copy numbers than others. I find this analysis to be a good bridge between students learning about cells and macromolecules to learning about how DNA directly codes for those proteins and what evolutionary forces may act on those genes.
The activity is set up for remove learning, where students view the data on Google Slides and answer the questions on the slides. When assigning to students, make sure that each students gets a copy so that their slides can be edited.
Another activity that relates to copy number variants is this short read on how CAG repeats are associated with Huntington’s disease. Number of repeats determine how the disease will manifest and suggests reason why the CNVs persist in the human population.
The final synthesis slide asks students to design an experiment using Benedict’s solution as a test for the presence of sugars. This experiment can be demonstrated for the class! Students can also do the tests on their own if they have access to boiling water. Benedicts will only react when the solutions are heated.