Many of my freshman students come to my class with only limited skills in graphing and data analysis. I spend time during the first chapter (scientific method) giving them practice with making graphs and analyzing data.
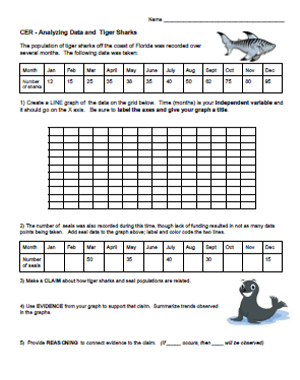
In this exercise, shark numbers are recorded in a chart for each month and students make a LINE graph to show how the population changes over time. Some students may need help setting the graph up, the directions only say to put the independent variable on the X axis (time).
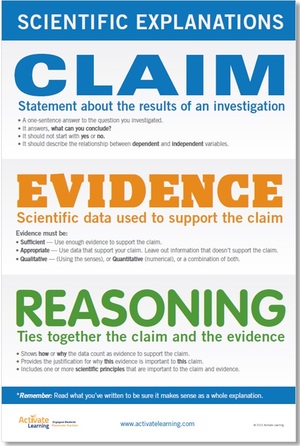
Students complete the exercise by completing a Claim, Evidence, Reasoning (CER) discussion. This is another area freshman students are usually unfamiliar with. I have a CER poster in my room and use it across all my classes.
This worksheet for freshman is pretty simple, and somewhat redundant. The evidence and reasoning statements will sound very similar in most cases. I teach them to make their reasoning statement in an “if-then” format. Though with my advanced (AP) students, we learn to tie evidence statements to underlying concepts or theories. Model teaching has some good advice and tips for teaching with CER’s.
This is the poster I have from Activate Learning, which I got for free at a conference, but you can also purchase one from their site. You can also make your own and simplify.