
Tag: graph
-
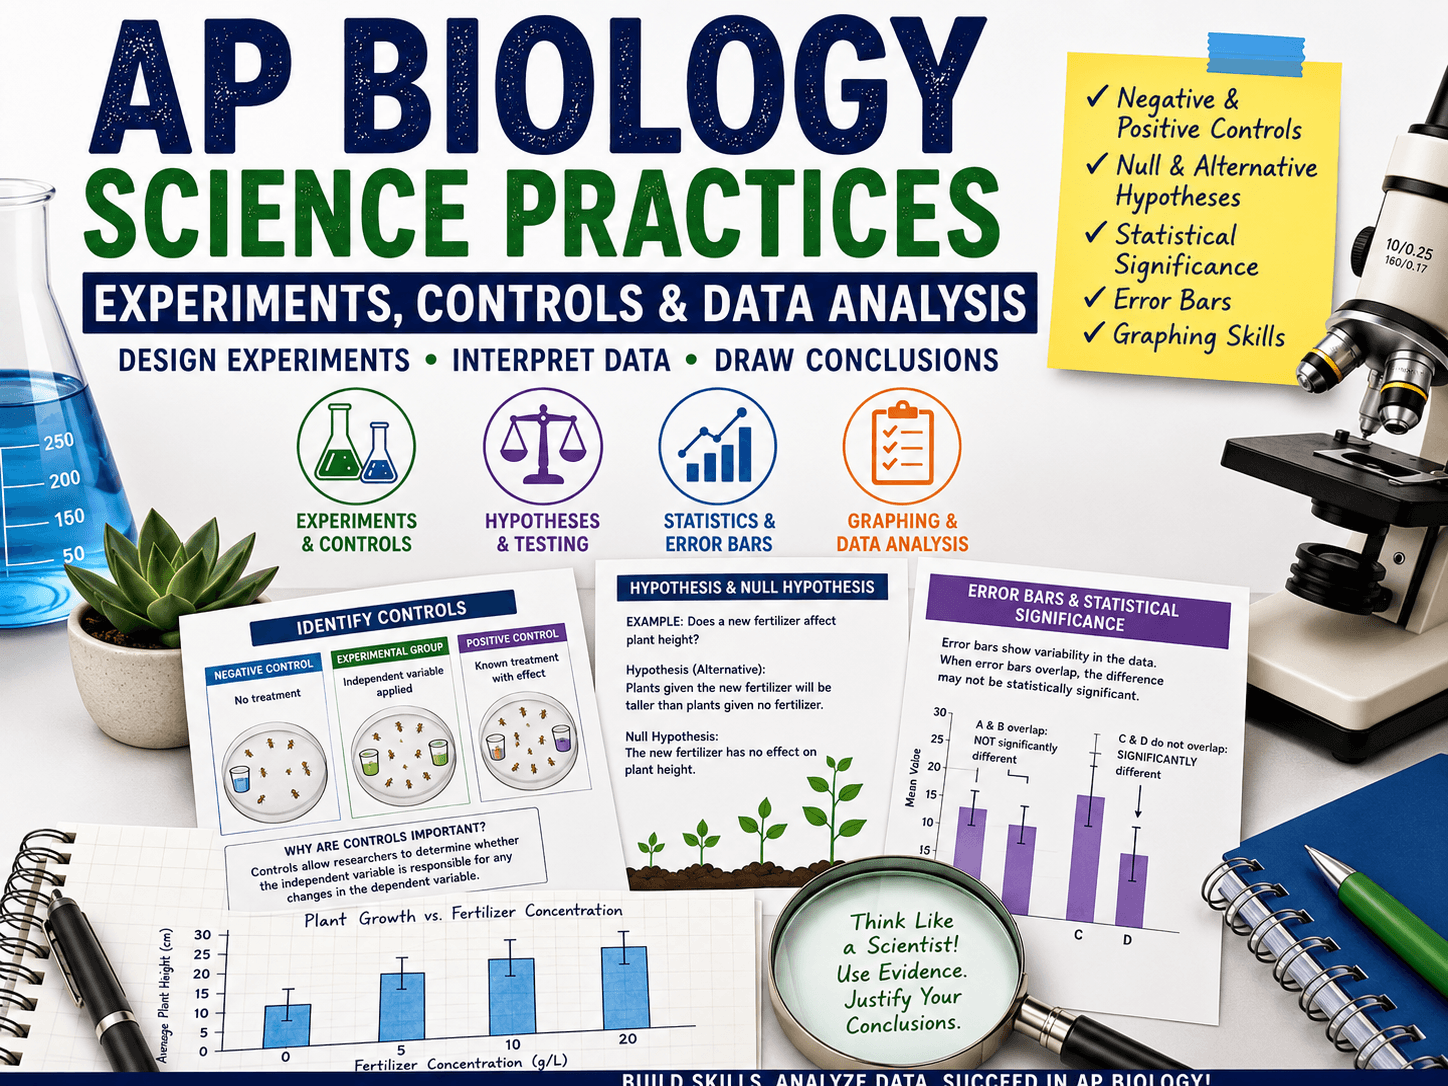
AP Bio Science Practices – Analyzing and Graphing Data
Success in AP Biology requires much more than memorizing biological concepts. The AP Biology exam emphasizes scientific thinking, the ability to design experiments, interpret data, evaluate evidence, and communicate scientific conclusions. This worksheet gives students targeted practice with the quantitative reasoning and experimental design skills that appear throughout the course and on the AP exam.…
-
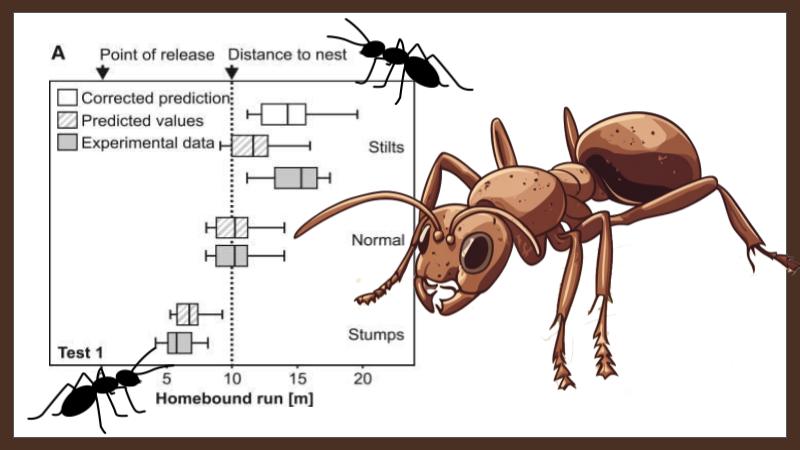
The Ant Odometer – Data Analysis
Have you ever thought about how ants navigate the world? Some ants use pheromones or other chemicals to follow trails. Other ants have a novel way of finding their way home; they count steps!How do these little biological Fitbits do this? How did scientists confirm that the ants counted steps? In this research study, scientists…
-
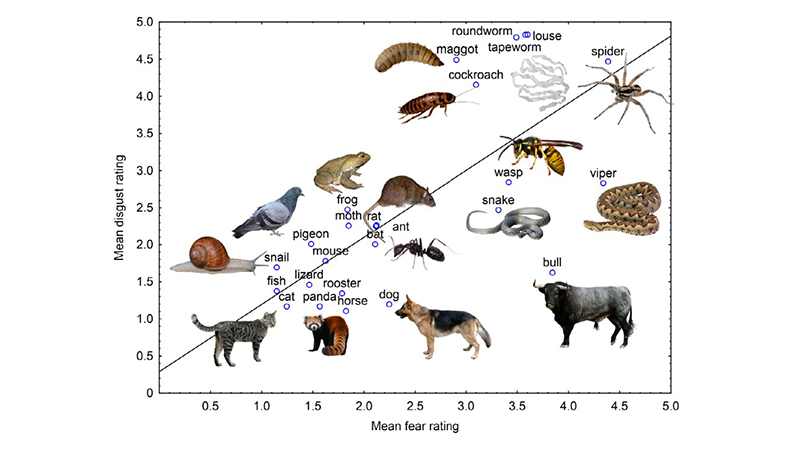
Spooky Science – Data Analysis on Fear and Disgust
Students explore what animals elicit feelings of disgust or fear. They analyze a graph and suggest evolutionary reasons for fear.
-
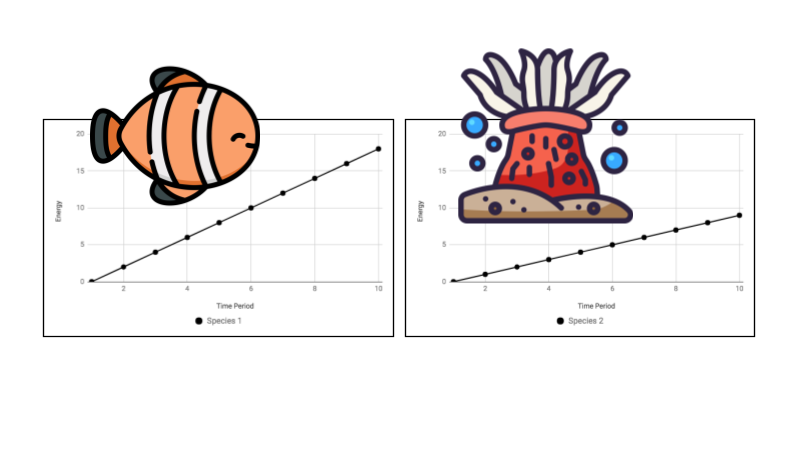
Symbiosis and Energy Use Graph Analysis
Students examine three graphs showing different types of symbiosis: mutualism, commensalism, and parasitism.
-
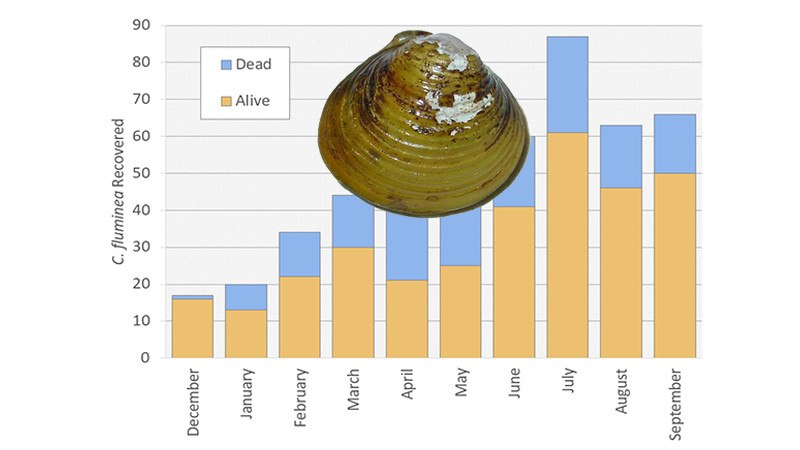
A Clammy Problem – Invasive Mollusks in Michigan
Examine a graph showing the numbers of invasive clams collected in a lake in Michigan. Answer basic questions about data and write a CER.
-
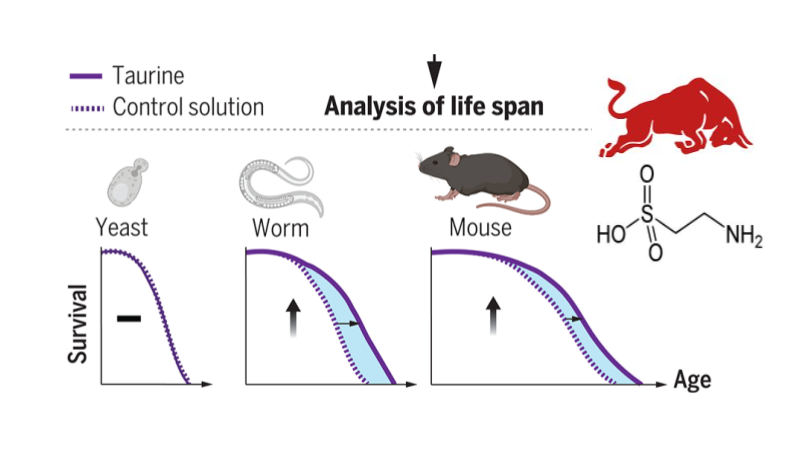
Interpreting Diagrams – Taurine and Aging (CER)
Students analyze a graph showing the effects of the amino acid taurine on aging. The data is from a primary source. Identify claim, evidence and reasoning.
-

Analyze Data and Create a Climate Graph
Students practice analyzing climate graphs of four regions in the United States. Answer simple questions and create a graph from data collected in Germany.
-
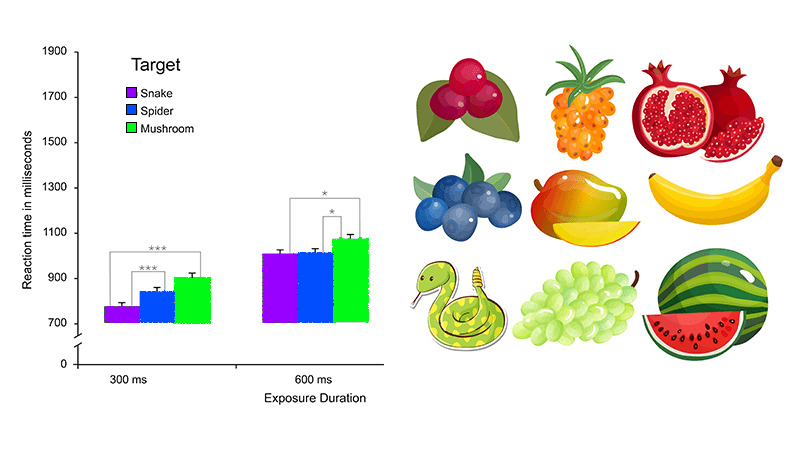
Analyzing Data – Snake Detection Hypothesis (CER)
Explore the snake detection hypothesis by reading about a study and identify claim and evidence.
-
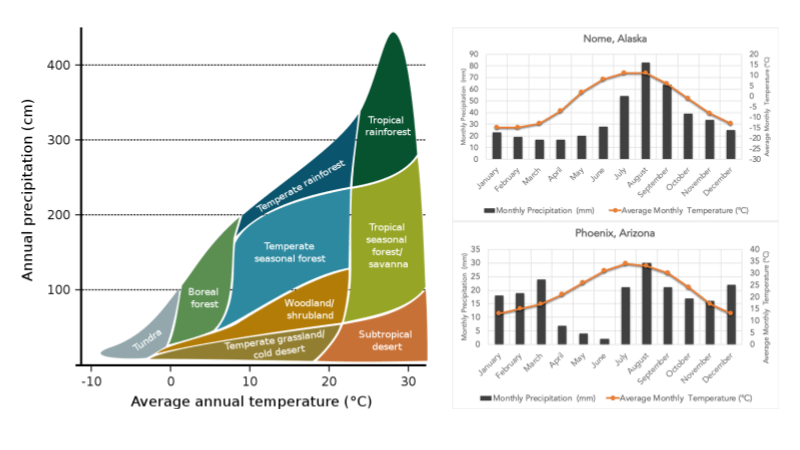
Analyzing Data – Explore Features of Biomes
Practice analyzing data from graphs in this exercise. There are several graphs that show precipitation and temperature of nine major biomes of the world.
-
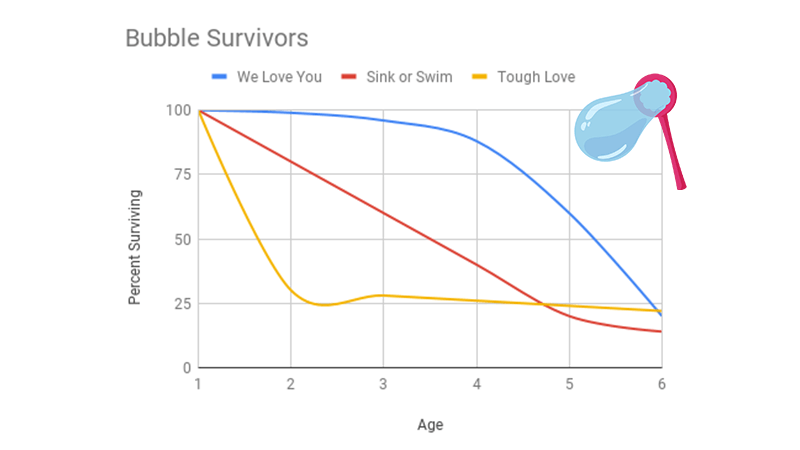
Modeling Survivorship Curves with Bubbles
A fun activity to model survivorship curves using bubbles. Students blow bubbles and time how long each survive under different conditions, then create a graph.
-
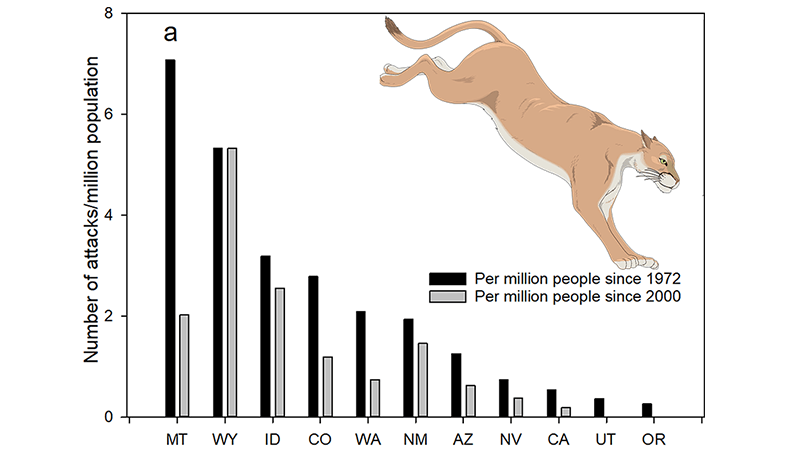
Can Sport Hunting Control Predator Populations?
Examine data that compares states that allow trophy hunting of pumas to California which does not allow hunting.
-
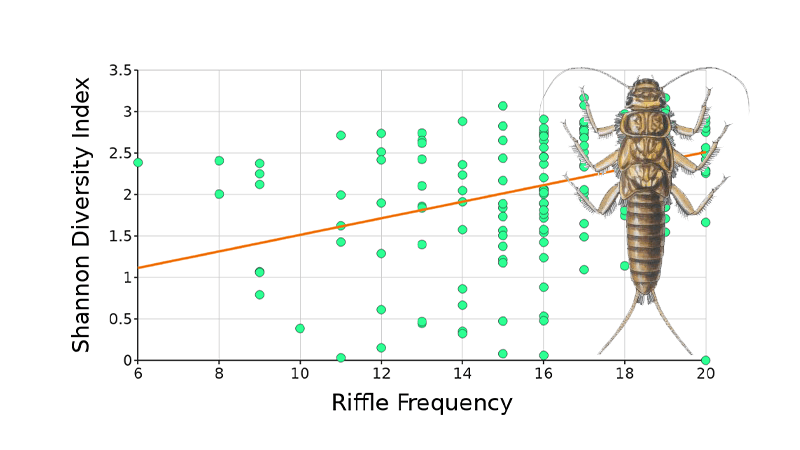
Measuring Water Quality with Biodiversity
Students manipulate data to show how water quality and stream diversity are connected. Dataclassroom is used to analyze data sets and complete a CER.
-
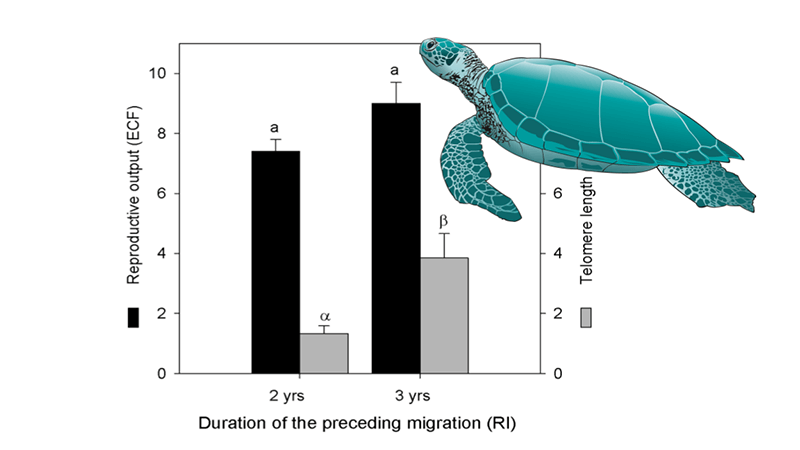
Analyzing a Turtle Graph from Primary Source
Examine data on turtle reproduction and migration. Annotate graphs and develop a claim; use reasoning to support that claim with data.
-
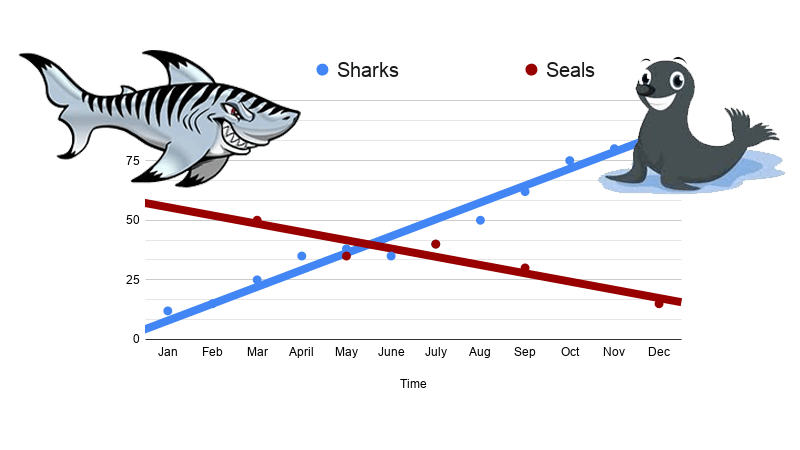
CER – Data Analysis with Sharks
Shark data by month where students make a LINE graph to show how the population changes over time. Students complete a CER to discuss results.
-
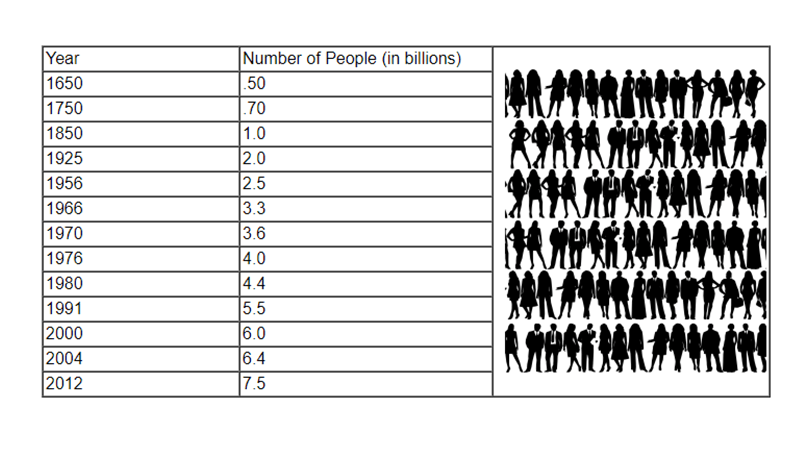
Human Population Growth
Students graph population estimates for years ranging from 1650 to 2012. The graph will show an exponential growth curve which students analyze to determine how frequently the population doubles. Students also explore the concepts of carrying capacity and growth rates. Questions ask students to discuss what happens when the earth exceeds its carrying capacity and…