
Tag: graph
-
DataClassroom
High school biology classrooms often lack the time and resources to do long term studies and data collection that researchers engage in. Luckily for us, many projects make their data available for use by schools. Organizations like HHMI and Data Nuggets have created student resources that focus on analyzing real scientific data. One of these…
-
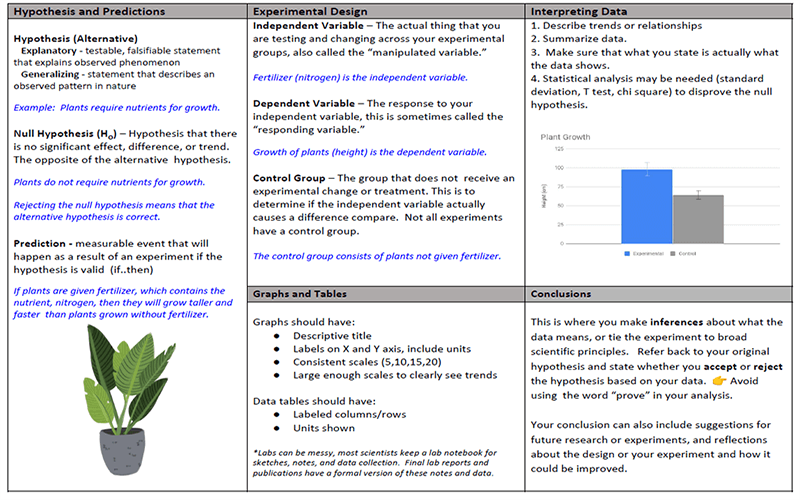
Experimental Design
Students in most science classes start with an overview of scientific processes. For advanced students, I use this cheat sheet to remind them of the major features of the scientific method, such as a control group, dependent and independent variables. AP Bio students are also introduced to the concept of the null and alternative hypotheses…
-
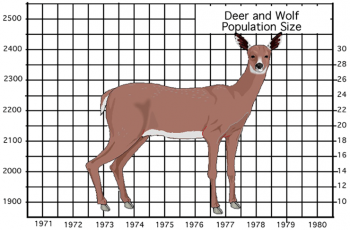
Deer: Predation or Starvation?
This activity asks students to calculate the population change (births – deaths) and then graph the number of deer and the number of wolves.
-
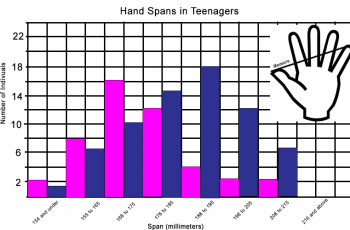
Graphing Hand Span and Height
This exercise illustrates the difference between bar graphs and scatter plots and walks students through the process of representing data they collect.
-
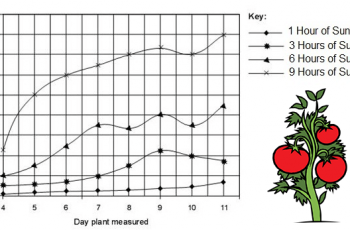
Data Analysis and Interpreting Graphs
Students practice analyzing pie charts, scatter plots, and bar graphs in the basic worksheet that is designed to pair with lessons on the scientific method. Most beginning biology students (in high school) are fairly adept at interpreting basic information from graphs, though scatter plots are sometimes challenging for them. I usually do this type…
-
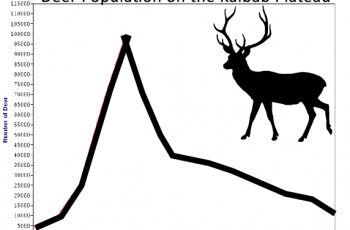
The Lesson of the Kaibab
This activity asks students to graph the number of kaibab deer on the plateau after predators were removed, then analyze data and develop a better plan.
-
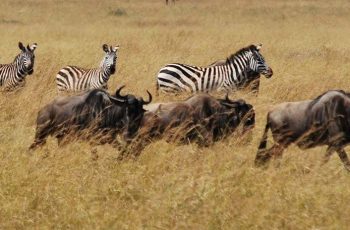
Niche Partitioning – Gorongosa Phenomenon
Explore niche partitioning in Gorongosa with this interactive graph and activity.
-
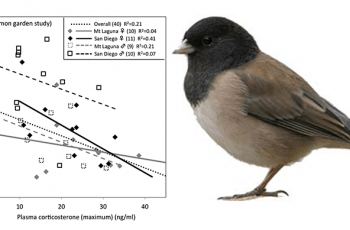
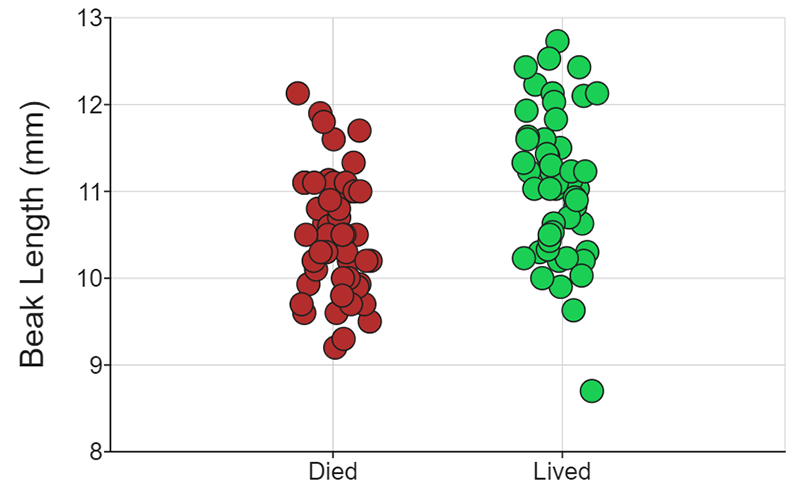
Data Analysis: Funky Juncos
View a short video about how a group of birds split from the main population and evolved in relative isolation near a college campus. The film is is 88 minutes long and all of its parts can be viewed at the Juncoproject.com, though for this activity, only one 16 minute chapter is viewed. The…
-

Investigation: Stride Length and Bone Lengths
This activity is intended to introduce students to spreadsheets while also reinforcing concepts learned in the unit on the skeletal system. While graphs may be easier to create using google sheets, student can still create graphs by hand using graph paper. Your class will need a set of meter sticks or rules to…
-

How to Use a Spreadsheet to Create a Graph
High school teachers often assume that their students know how to use basic word processing programs, internet browsers, and spreadsheets. My students come to me with very little knowledge in how to do advanced tasks in those platforms, like inserting a graph or image. I created this assignment to give students an introduction into…
-
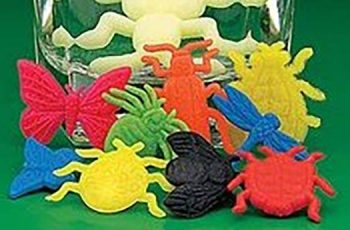
Growing Sponge Animals
This simple activity provides an introduction to laboratory techniques and data collection. Students measure how a sponge animal toy grows when submerged in cold and warm water.
-
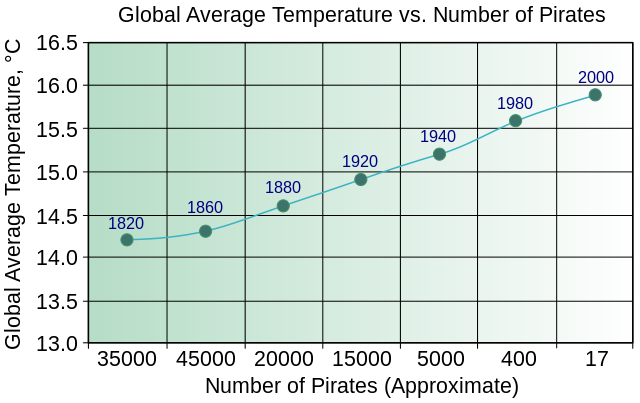
Analyzing and Interpreting data with Graphs
NGSS and AP Biology resources for interpreting data exercises in the classroom. Turn graphs into discussions and mysteries.