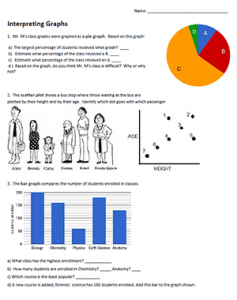
Students practice analyzing pie charts, scatter plots, and bar graphs in the basic worksheet that is designed to pair with lessons on the scientific method. Most beginning biology students (in high school) are fairly adept at interpreting basic information from graphs, though scatter plots are sometimes challenging for them.
I usually do this type of exercise during the first unit where the scientific method is discussed. Students learn the helpful mnemic: DRY MIX.
Dependent = Responding –> Y axis
Manipulated = Independent –> X axis
Students eventually learn how to create their own graphs and determining which variables go on the x axis (independent) and which go on the y axis (dependent) and how to use one graph to represent multiple data sets. I usually don’t spend a lot of time here, and use the worksheet as either a warm-up or an end of class reinforcement exercise.
Other Graphing Activities
Another simple graphing exercise is “Flow Rates Through a Pipe.” Students view two sets up data on pipes with different diameters. Then they graph the flow rate through each pipe.
The variables are directly related: the bigger the pipe, the faster the flow!
If you want a more hands-on lab. Try “Graphing with Growing Animals.” Students submerge growing sponge toys in warm or cool water. They record data on the size of the sponge over time and graph the data.
Grade Level: 6-9
Time Required: 10-15 minutes
NGSS Science and Engineering Practices : Analyzing and Interpreting Data

