
Tag: interpet
-
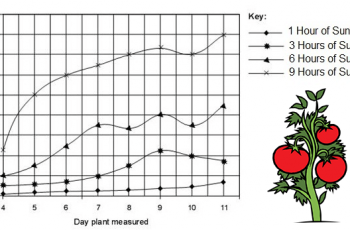
Data Analysis and Interpreting Graphs
Students practice analyzing pie charts, scatter plots, and bar graphs in the basic worksheet that is designed to pair with lessons on the scientific method. Most beginning biology students (in high school) are fairly adept at interpreting basic information from graphs, though scatter plots are sometimes challenging for them. I usually do this type…