
Tag: analysis
-
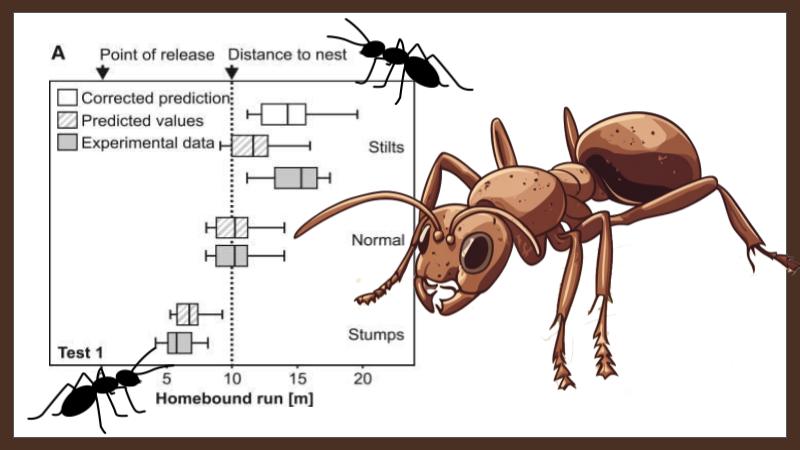
The Ant Odometer – Data Analysis
Have you ever thought about how ants navigate the world? Some ants use pheromones or other chemicals to follow trails. Other ants have a novel way of finding their way home; they count steps!How do these little biological Fitbits do this? How did scientists confirm that the ants counted steps? In this research study, scientists…
-
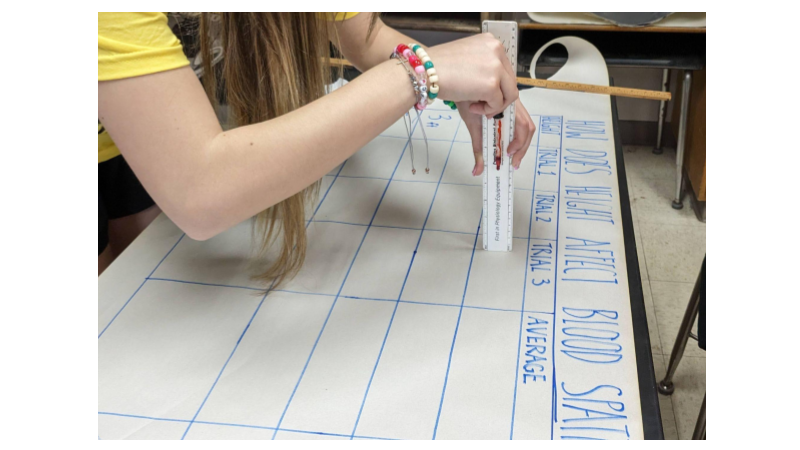
Forensics Lab on Blood Spatter
Explore forensics with this lab on blood stain analysis. Use fake blood to determine how height affects the diameter of the stain
-
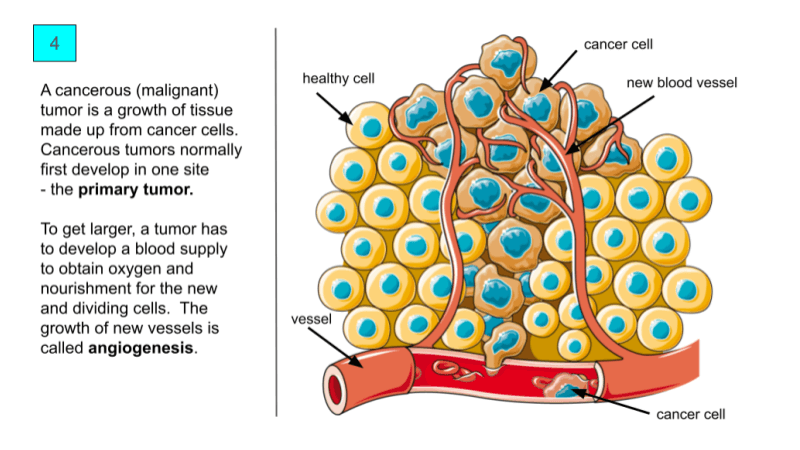
Mitosis and Cancer – Data Analysis on Carcinogenesis
A group activity where students analyze images and charts to determine the relationship between mitosis and cancer.
-
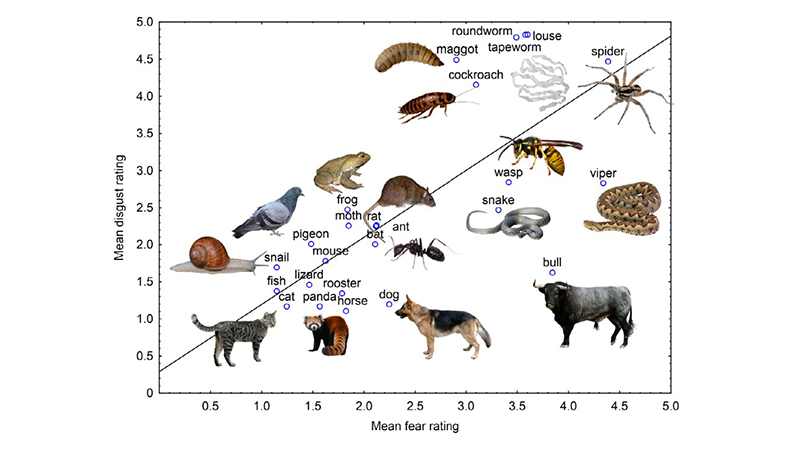
Spooky Science – Data Analysis on Fear and Disgust
Students explore what animals elicit feelings of disgust or fear. They analyze a graph and suggest evolutionary reasons for fear.
-
Scary Pumpkin Statistics
Students predict the number of seeds in a pumpkin and then count the seeds. They use chi square analysis to accept or reject the null hypothesis.
-

Analyze Data and Create a Climate Graph
Students practice analyzing climate graphs of four regions in the United States. Answer simple questions and create a graph from data collected in Germany.
-
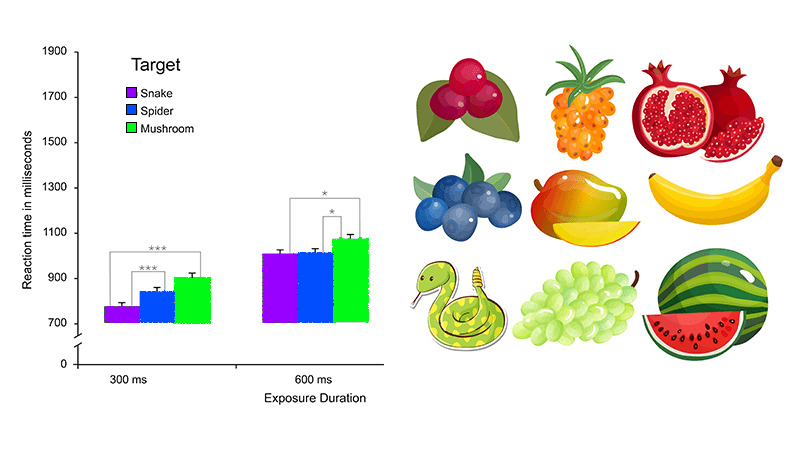
Analyzing Data – Snake Detection Hypothesis (CER)
Explore the snake detection hypothesis by reading about a study and identify claim and evidence.
-
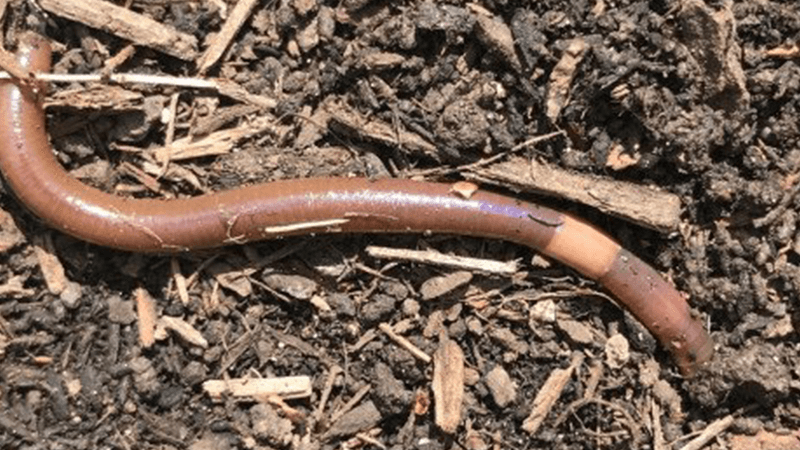
Data Analysis – Invasion of the Jumping Worms
Lesson plan uses the 5E model to explore the invasive Asian Jumping Worm and its impact on soil and forests; includes data analysis.
-
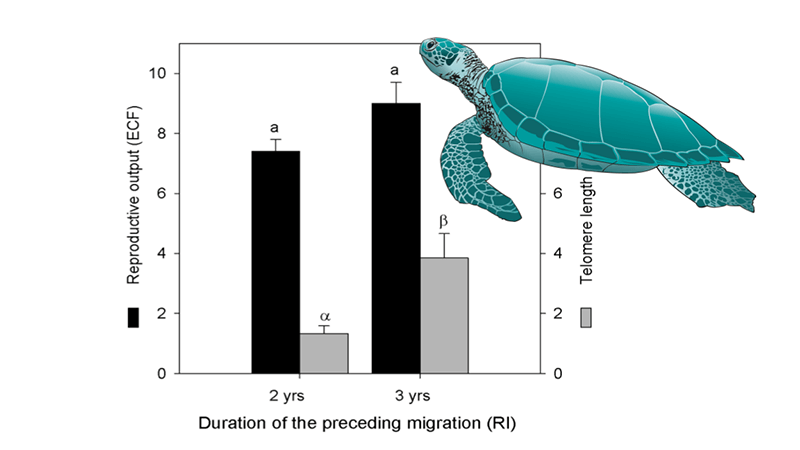
Analyzing a Turtle Graph from Primary Source
Examine data on turtle reproduction and migration. Annotate graphs and develop a claim; use reasoning to support that claim with data.
-
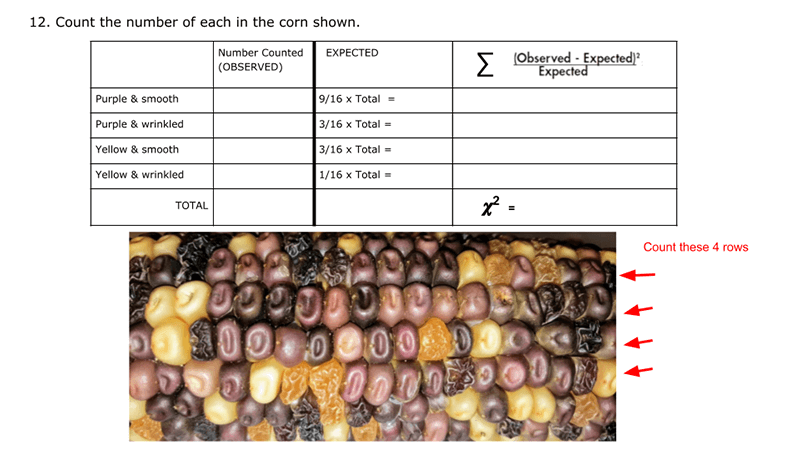
Corn Chi Square (remote)
This is the remote version of a classroom activity I do with corn ears. Students would count the kernels (smooth, wrinkled, purple, yellow) and determine if the ears of corn are the result of a dihybrid cross, RrPp x RrPp. This gives students the opportunity to apply statically analysis to data sets and determine if…
-
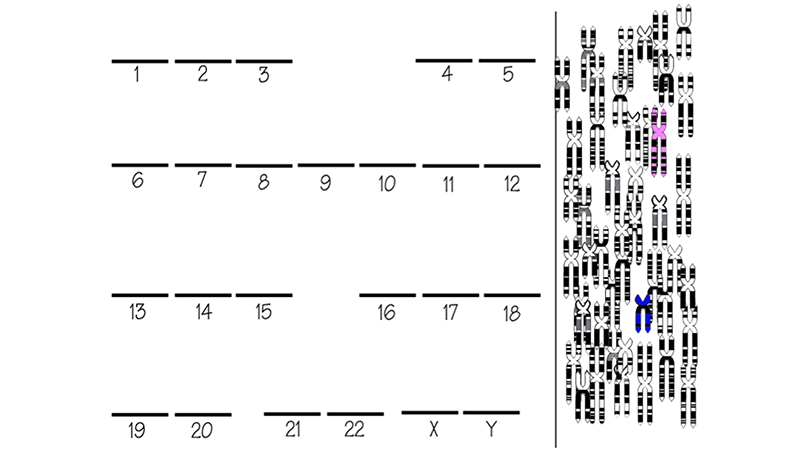
Karyotype Analysis Using Google Slides
Students group homologous pairs of chromosomes and arrange them by size on the grid using google slides. Diagnose the genetic disorder.
-
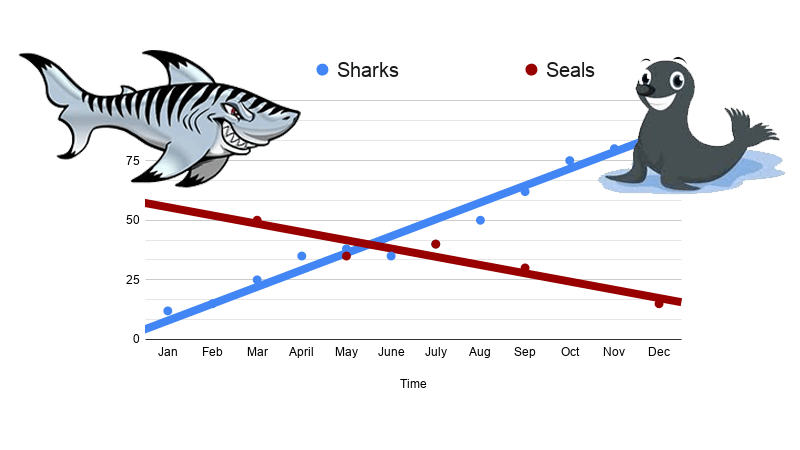
CER – Data Analysis with Sharks
Shark data by month where students make a LINE graph to show how the population changes over time. Students complete a CER to discuss results.
-
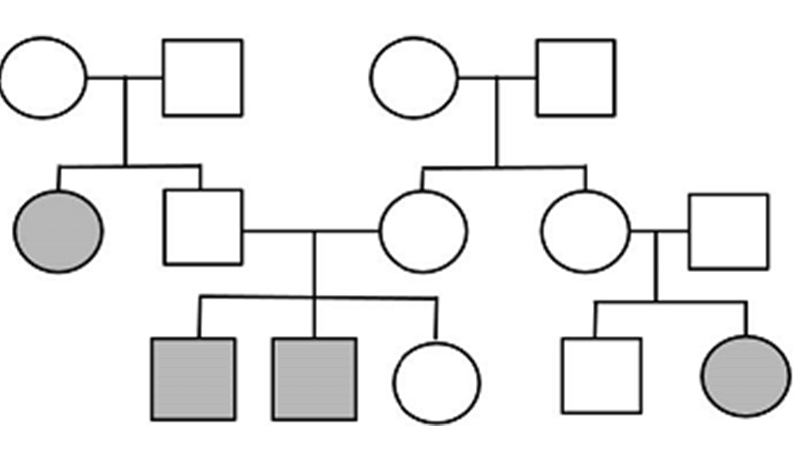
Pedigree Analysis – AP Bio
Designed for biology students studying genetics. Determine the inheritance pattern for human disorders, like Tay-Sachs or Marfan Syndrome.
-
Data Analysis and Interpreting Graphs
Students practice analyzing pie charts, scatter plots, and bar graphs in the basic worksheet that is designed to pair with lessons on the scientific method. Most beginning biology students (in high school) are fairly adept at interpreting basic information from graphs, though scatter plots are sometimes challenging for them. I usually do this type…
-

Investigation: How Does Exercise Affect Heart Rate
Design and conduct an experiment to measure the effect of exercise on heart rate. Aligned to NGSS standard on feedback mechanisms.