
A fun activity for the spooky season. Students in AP Biology learn various ways to analyze data. They learn how to calculate and graph the standard error of the mean. They also do chi square analysis to determine statistical significance of data.
Students enter the lab to find stations, each with a pumpkin. To save money, put students in groups of 3 or 4. My small AP Biology class would only need 5 pumpkins. Check local farms for cheap pumpkin prices, especially in October! You might even be able to get them to donate some of their “ugly” pumpkins!
Since I do this project in the first semester, students have not had much experience with statistics. I introduce the topic in the first chapter on the scientific method. They have already learned about standard error and standard deviation.
Usually, chi square analysis isn’t addressed until second semester when students learn genetics. They use the goodness of fit test to determine if their expected 9:3:3:1 ratio is observed in corn ears. With this lab, they get a little experience with the analysis earlier in the year.
In the Lab
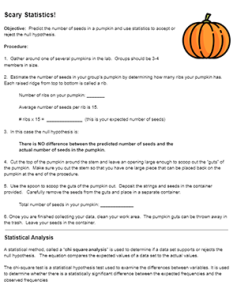
Students begin the activity by counting the ribs of the pumpkin. Then they use a formula to estimate the number of seeds based on the number of ribs. The average number of seeds per rib is 15. Students record this into a data table and add the data from the other groups. This is the EXPECTED number of seeds.
Students also revisit the concept of the null hypothesis. In this case, the null hypothesis states that there is no difference between the predicted number of seeds and the actual number.
Next, students cut the pumpkin and removing the guts. They should just cut the top where the stem is, so that it can be put back on later. Then they carefully remove the seeds and place them in a container for counting. The guts are thrown away (though, you could save them for making a pie!). I do have students save the seeds. I may even have them try to germinate the seeds and grow a pumpkin, but the timing (October) isn’t great. At the very least, you could use the seedlings in other projects.
Once they have gathered the data from each group, students use a chart to do the chi square analysis. I find that beginning students struggle with the formula. I make it easier by having them calculate in steps. (Observed – Expected) 2 / Expected. Then they add all the values together to get the sum, which is the chi square value.
Using the chi square table, students then determine if they reject or accept the null hypothesis. In this case, the null hypothesis is that there is no difference between the expected number of seeds and the observed. Two analysis questions ask students to analyze how statistics are used in the scientific method.
The Fun Stuff
Once all the calculations and analysis are completed, students can design their jack-o’-lanterns! I suggest they make a science themed pumpkin, but they can also do a traditional carving. If this is around Halloween, you can display the pumpkins in the class or students can take them home. Since there are four per group, you might want to have some kind of raffle to determine who gets the pumpkin.