
Tag: graphing
-
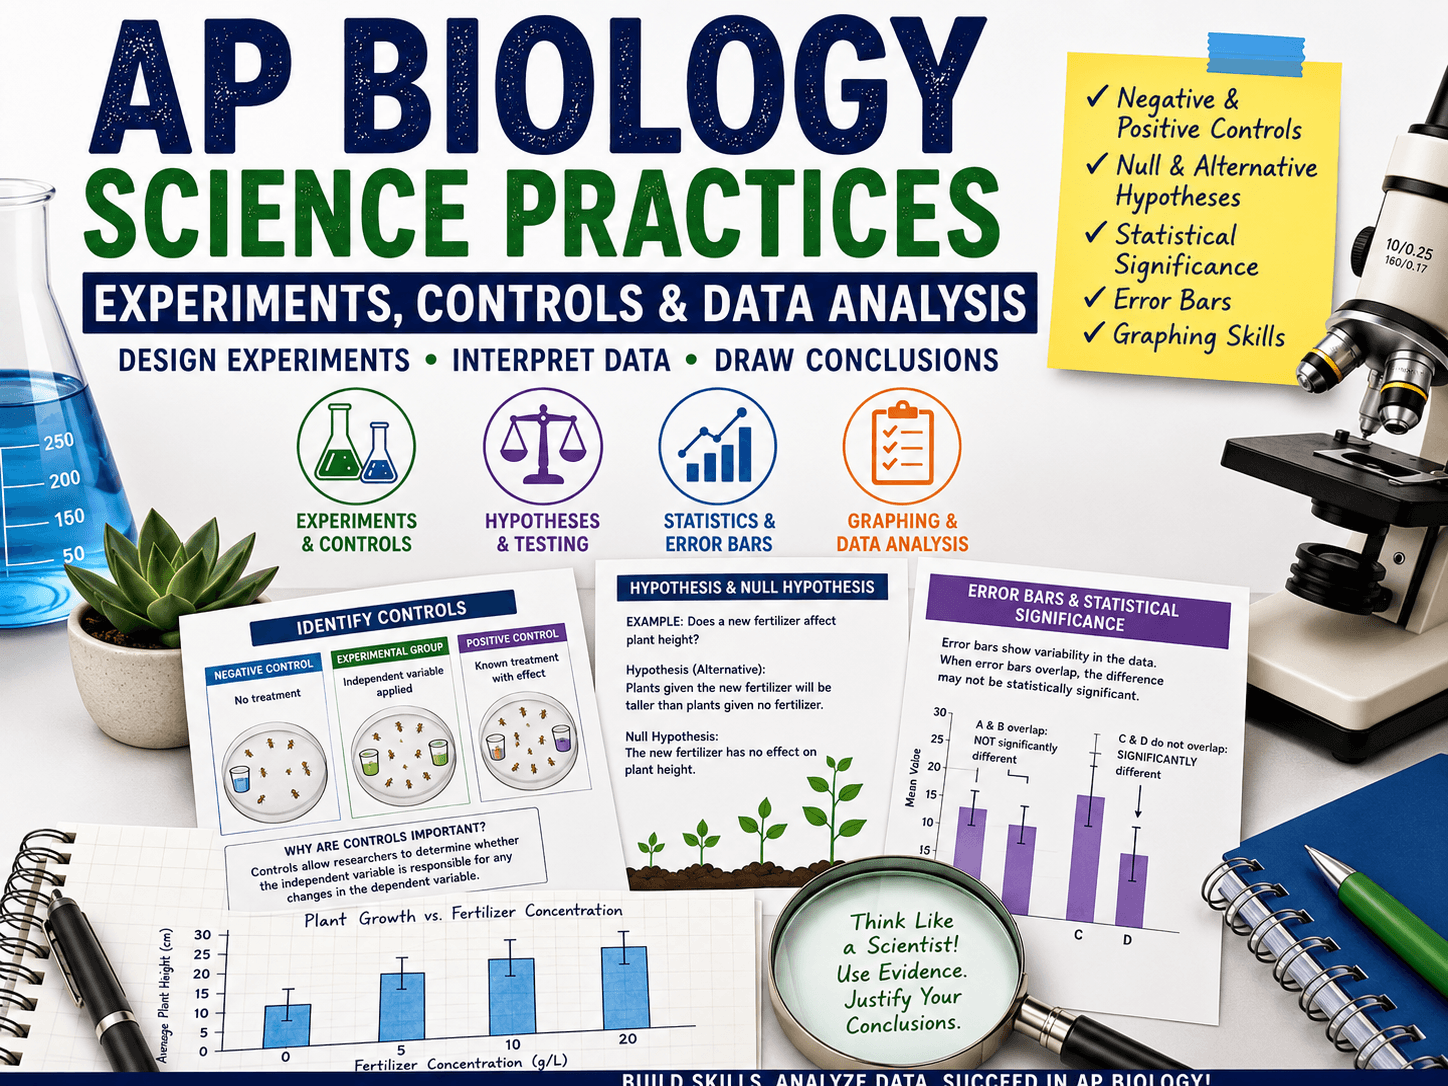
AP Bio Science Practices – Analyzing and Graphing Data
Success in AP Biology requires much more than memorizing biological concepts. The AP Biology exam emphasizes scientific thinking, the ability to design experiments, interpret data, evaluate evidence, and communicate scientific conclusions. This worksheet gives students targeted practice with the quantitative reasoning and experimental design skills that appear throughout the course and on the AP exam.…
-
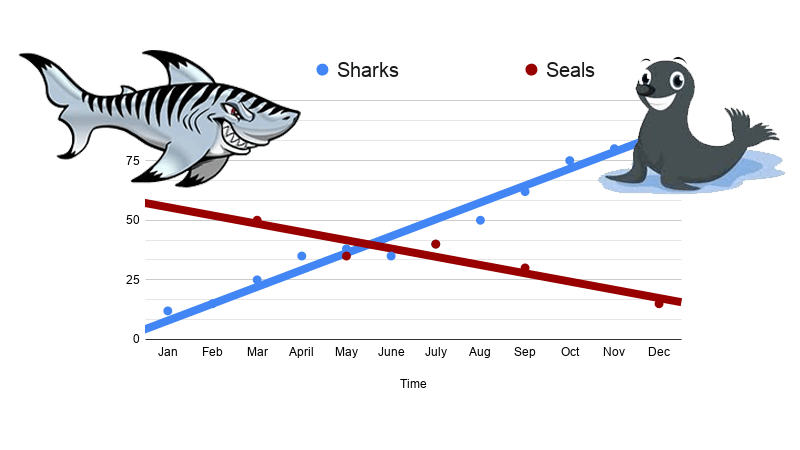
CER – Data Analysis with Sharks
Shark data by month where students make a LINE graph to show how the population changes over time. Students complete a CER to discuss results.
-
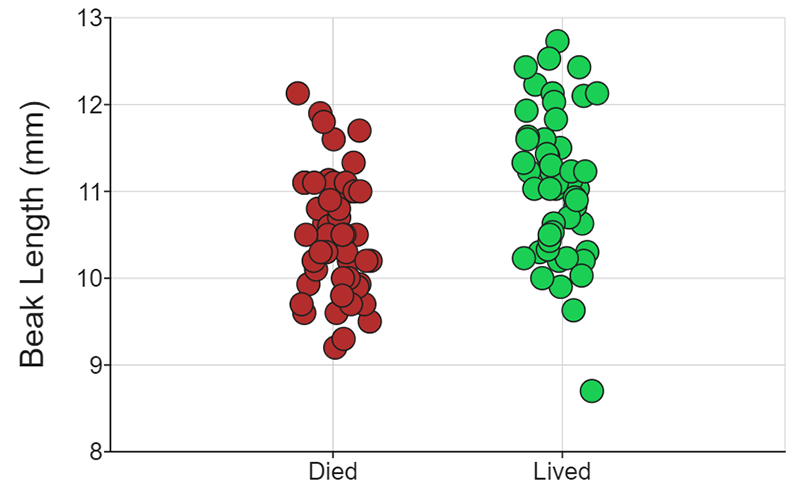
DataClassroom
High school biology classrooms often lack the time and resources to do long term studies and data collection that researchers engage in. Luckily for us, many projects make their data available for use by schools. Organizations like HHMI and Data Nuggets have created student resources that focus on analyzing real scientific data. One of these…
-
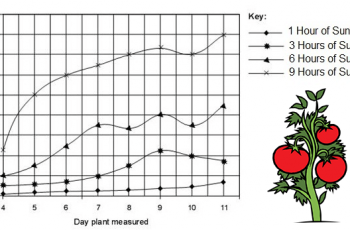
Data Analysis and Interpreting Graphs
Students practice analyzing pie charts, scatter plots, and bar graphs in the basic worksheet that is designed to pair with lessons on the scientific method. Most beginning biology students (in high school) are fairly adept at interpreting basic information from graphs, though scatter plots are sometimes challenging for them. I usually do this type…
-

How to Use a Spreadsheet to Create a Graph
High school teachers often assume that their students know how to use basic word processing programs, internet browsers, and spreadsheets. My students come to me with very little knowledge in how to do advanced tasks in those platforms, like inserting a graph or image. I created this assignment to give students an introduction into…