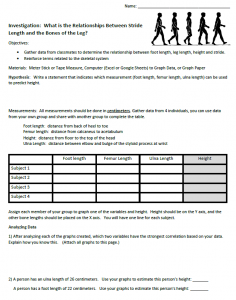
This activity is intended to introduce students to spreadsheets while also reinforcing concepts learned in the unit on the skeletal system. While graphs may be easier to create using google sheets, student can still create graphs by hand using graph paper. Your class will need a set of meter sticks or rules to take measurements on the length of their foot, ulna, and femur.
Several graphs will be made showing the relationships between height and femur length, height and ulna length, and height and foot length. In all cases, students should be able to observe a direct relationship between those variables.
Students are then asked to use their graph to make predictions about a person’s height based on foot size and the graphs they created.
The next part of the exercise asks students to measure their stride length and compare that to foot and leg lengths. Students can use a marked area to determine how long their stride is based on walking for 20 meters.
Final analysis and extensions ask students to consider a crime scene that include a set of footprints and to examine how the footprint of a chimpanzee differs from the footprint of a human. Students can use the graphs they have made to estimate the height of the two burglars based on footprints left at the crime scene.

Time Required: 45-60 minutes
Grade Level: 10-12
NGSS Practices: Asking questions (for science) and defining problems (for engineering), Developing and using models, Planning and carrying out investigations, Analyzing and interpreting data, Using mathematics and computational thinking

