
This activity asks students to calculate the population change (births – deaths) and then graph the number of deer and the number of wolves. Population change data refers to the the changes in the number of individuals living in a particular area over a period of time. The population can fluctuate due to external factors, such as food availability and predation.
In the introduction, a population of deer and were in danger of starvation due to lack of food. The area was too remote for hunting, so ecologists decide to introduce a predator of the deer: wolves.
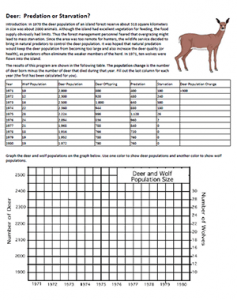
Students use the data on wolf and deer numbers to create a graph showing changes in the population. Then they use the graph to determine if measures taken to control the deer population were successful.
Zero population growth (ZPG) is also defined and students must determine which year was closest to ZPG. This is the time on the graph when the line for the deep population doesn’t go up or down. It indicates that the number of births are about the same as the number of deaths in the population.
Finally, students summarize the relationship between wolves and deer and to make judgments about whether wildlife management should include the reintroduction of predators. They also discuss the “balance of nature” hypothesis by writing their own opinion about wildlife management.
The hypothesis proposes that healthy ecological systems are usually in a stable equilibrium. The number of predators and prey may change slightly over years, but will tend to remain “in balance.” Introducing wolves to the system is an attempt to restore the balance.
Grade Level: 9-12
Time Required: 15-20 minutes + discussion
HS-LS2-1 Use mathematical and/or computational representations to support explanations of factors that affect carrying capacity of ecosystems at different scales.