
Do you find that your students need more practice with analyzing graphs and manipulating data? Laboratory exercises in the classroom can be time consuming. For some concepts, students would need to collect data over long periods of time. Fortunately, many projects done at universities make data publicly available. This allows students to analyze data sets without doing the actual collection of the data.
Graphing applications and spreadsheets can also be time consuming for students to learn. In learning the scientific method, I prefer not to also be teaching students how to make spreadsheets. (That can come later!)
This is why I love dataclassroom.com, which is an app that helps students visualize and manipulate data sets. The program stores raw data that can be converted to graphs with a click of a button. Students can use the data to set up experiments where they can create graphs that illustrate relationships. For example, students can visualize a data set the osmosis lab, showing that percent change in mass in various sucrose solutions. In addition to doing the lab with their own data sets, students can view data on Dataclassroom.com as a comparison.
Water Quality Data Lab
My biology class usually starts with lab procedures, the scientific method, and data analysis. I use the CER (claim, evidence, reasoning) framework in most of the labs. We also learn how to set up graphs, with the independent variable on the X axis, and the dependent variable on the Y axis. This is a good time to introduce students to real world data and scientific problem solving with Dataclassroom data set on water quality.
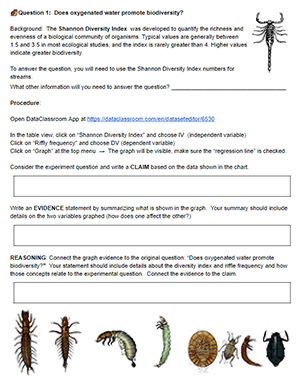
Students read the background of the study that explains how biodiversity is a measure of the number of species in an area (Shannon Diversity Index). That measurement can be used to answer questions about stream quality, such as:
- Does oxygenated water promote biodiversity?
- How does the size of the vegetative zone affect the diversity of the invertebrates in the stream?
- How does the presence of a species indicate the health of a stream?
To answer these questions, students must choose which variables to display on the graph, summarize the graph, and then provide a reasoning statement that links the evidence to the claim.
The instructions provide a clear step-by-step guide on how to set up the graphs and manipulate data, though once students become familiar with using Dataclassroom, they will not need detailed instructions. The app is user friendly!
The Google Doc contains the background information and the student instructions. Additionally, Dataclassroom provides a field guide if you have the opportunity to take students to a local stream and collect macroinvertebrates.