
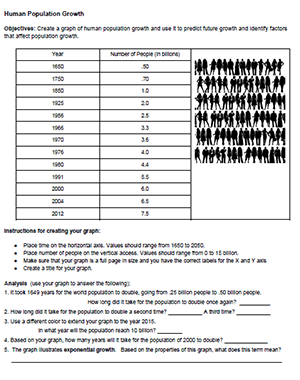
Students graph population estimates for years ranging from 1650 to 2012. The graph will show an exponential growth curve which students analyze to determine how frequently the population doubles.
Students also explore the concepts of carrying capacity and growth rates. Questions ask students to discuss what happens when the earth exceeds its carrying capacity and how populations reach zero population growth.
The overall exercise is focused on practice with graphing, dealing with scale and labeling the X and Y axis. Even in high school, students can struggle with these concepts.
A common error in making the graph is students do not space units properly on the axes. The data has years, but not in even intervals. Depending on the level, you may need to help students with creating their X and Y units.
Time Required: 25-35 minutes
Grade Level: 9-12
HS-LS2-1 Use mathematical and/or computational representations to support explanations of factors that affect carrying capacity of ecosystems at different scales.