
In this exercise students examine a bar graph that includes two distinct data points on a single bar. This type of graph may be new to beginning biology students. The bars show the number of clams counted that were alive and the number of clams that were dead. Both on on the same bar!
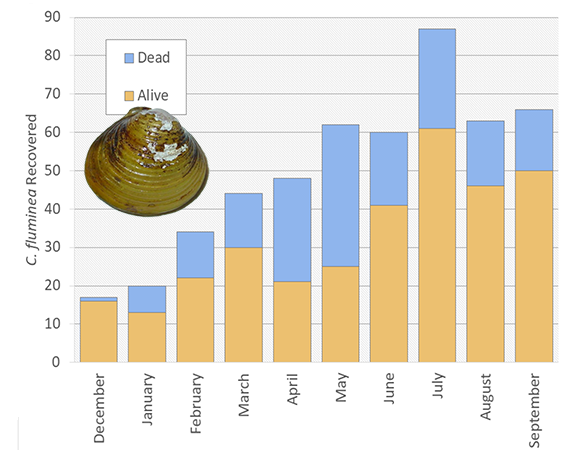
Notice on the graph, the blue section represents clams that are dead. Yellow bars are clams that were alive. The X axis indicates the month. (The student version is black and gray for printing.)
Students will need to do a little math to answer the questions. For example, one question asks how many total clams were recovered in April. The next asks how many of those clams were alive and how many were dead. The alive clams are easy, just follow the yellow bar (about 21). Dead clams require some math. Researchers recovered 48 total clams in April. 48 – 21 = 27.
This is a good exercise for a unit on ecosystems and invasive species. It could also be used for scientific method and data analysis. As students progress through science, they will encounter many types of graphs.
Data analysis is part of the NGSS Science and Engineer Practices.