
Tag: data
-
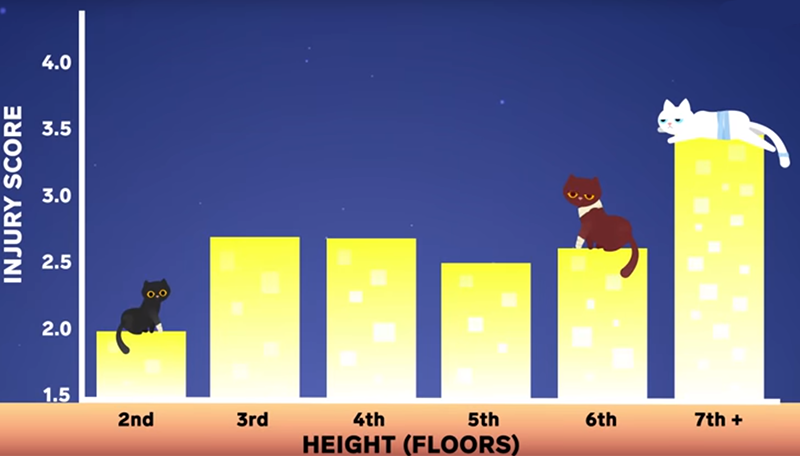
Falling Cats – CER
Students practice Claim, Evidence, and Reasoning (CER) while examining the relationship between falling height and cat injuries. The graphs show that cats who fall 2-7 stories often suffer more injuries than cats who fall from greater distances. Not much information is given about how the data was collected, though the original source is included, I…
-
DataClassroom
High school biology classrooms often lack the time and resources to do long term studies and data collection that researchers engage in. Luckily for us, many projects make their data available for use by schools. Organizations like HHMI and Data Nuggets have created student resources that focus on analyzing real scientific data. One of these…
-
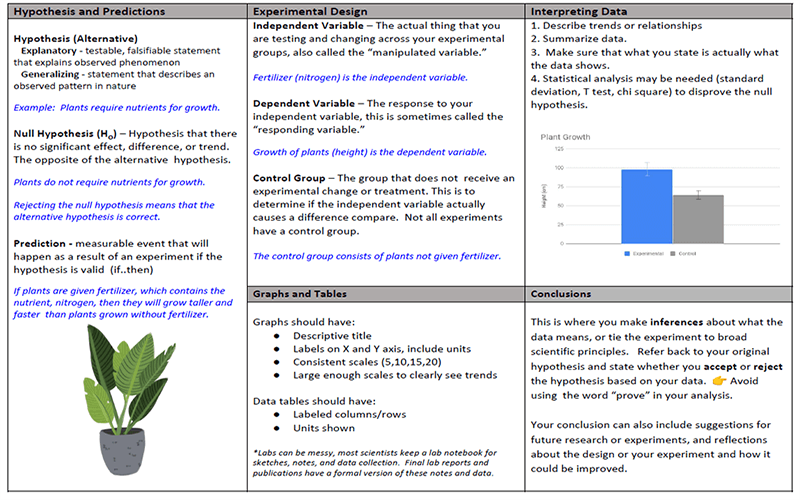
Experimental Design
Students in most science classes start with an overview of scientific processes. For advanced students, I use this cheat sheet to remind them of the major features of the scientific method, such as a control group, dependent and independent variables. AP Bio students are also introduced to the concept of the null and alternative hypotheses…
-

Reinforcement: Scientific Processes
I designed this worksheet for an introductory biology class. It reinforces concepts that are introduced in the first chapter. Students learn about how science works, what a hypothesis is, and how data is analyzed. Reinforcement worksheets have definitions or sentences that include a key word and students much choose from a bank of vocabulary words…
-
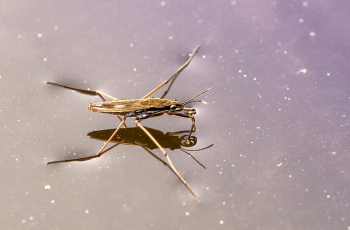
Investigation: How Does a Water Strider Stay Afloat?
This lab was modified from the “Penny Lab” to focus more on the properties of water and how surface tension is important for aquatic organisms like the water strider. The instructions were designed for an intro (vocational) biology class that only meets for a semester.
-
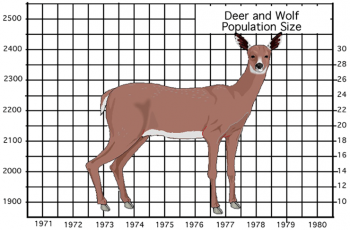
Deer: Predation or Starvation?
This activity asks students to calculate the population change (births – deaths) and then graph the number of deer and the number of wolves.
-
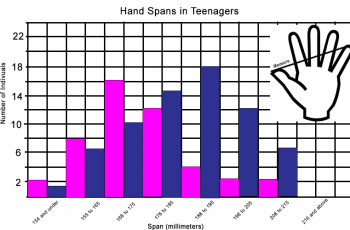
Graphing Hand Span and Height
This exercise illustrates the difference between bar graphs and scatter plots and walks students through the process of representing data they collect.
-
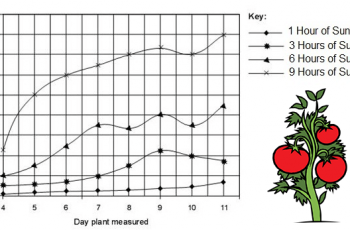
Data Analysis and Interpreting Graphs
Students practice analyzing pie charts, scatter plots, and bar graphs in the basic worksheet that is designed to pair with lessons on the scientific method. Most beginning biology students (in high school) are fairly adept at interpreting basic information from graphs, though scatter plots are sometimes challenging for them. I usually do this type…
-

Investigation: How Does Exercise Affect Heart Rate
Design and conduct an experiment to measure the effect of exercise on heart rate. Aligned to NGSS standard on feedback mechanisms.
-
Niche Partitioning – Gorongosa Phenomenon
Explore niche partitioning in Gorongosa with this interactive graph and activity.
-
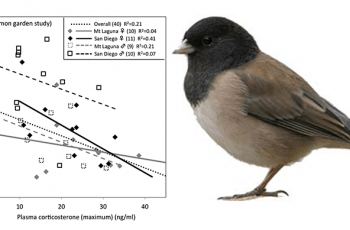
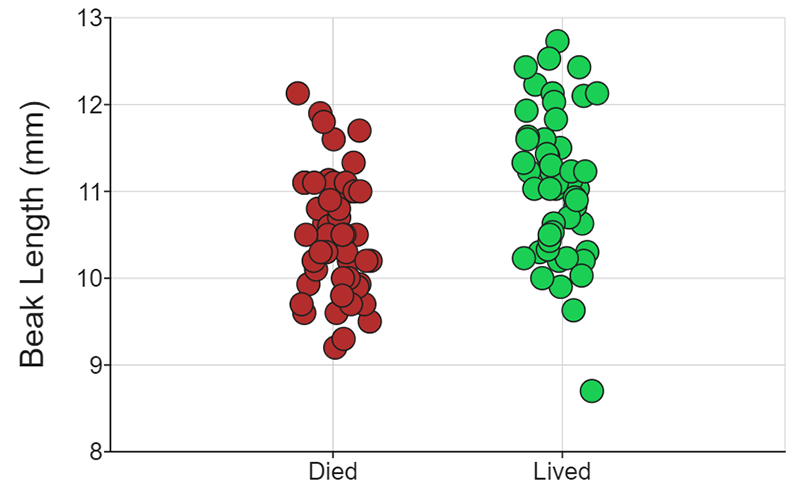
Data Analysis: Funky Juncos
View a short video about how a group of birds split from the main population and evolved in relative isolation near a college campus. The film is is 88 minutes long and all of its parts can be viewed at the Juncoproject.com, though for this activity, only one 16 minute chapter is viewed. The…
-
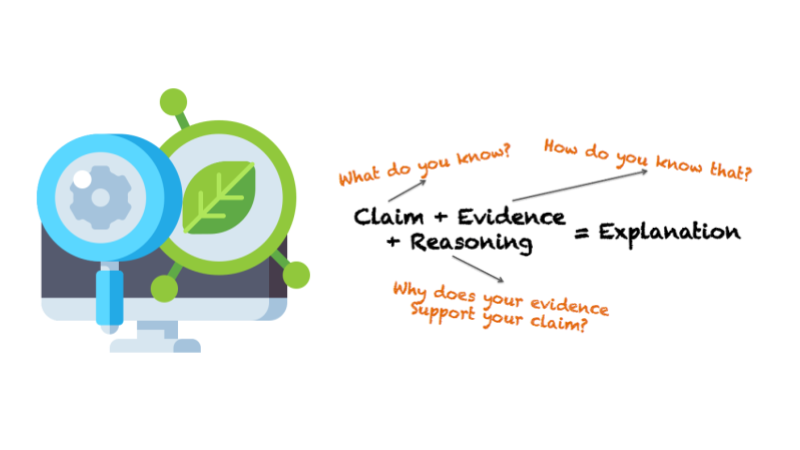
Claim, Evidence, Reasoning (CER) Science Topics
A list of topics and articles for students to use to practice claim, evidence, and reasoning.
-
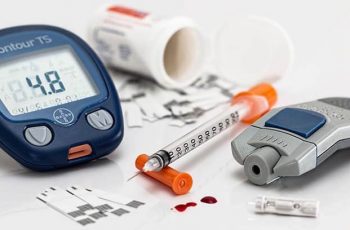
Case Study: Can a Virus Cause Diabetes?
This case asks students to examine data on children diagnosed with Type 1 Diabetes after reading a short story about a young girl who was losing weight and feeling thirsty. The content looks at a possible connection between diabetes and infection by the coxsackie virus, a virus that is responsible for “hand, foot, and mouth”…
-
Lab Report Guidelines and Template
Help students organize a lab report for any experiment, includes basic layout: title, introduction, hypothesis, materials and methods, data, and conclusions.
-

How to Use a Spreadsheet to Create a Graph
High school teachers often assume that their students know how to use basic word processing programs, internet browsers, and spreadsheets. My students come to me with very little knowledge in how to do advanced tasks in those platforms, like inserting a graph or image. I created this assignment to give students an introduction into…