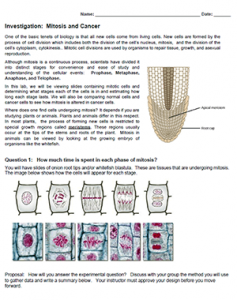
The first part of this investigation, students examine slides of mitosis in an onion root tip and count the number of cells in each phase of the cell cycle. An equation is then used to estimate the percentage of time the cell spends in each phase and students create a bar graph to display results. A CER (claim, evidence, reasoning) chart is required for analysis to answer the question: “How much time is spent in each phase of the cell cycle?”
Part two of the investigation presents a more challenging activity where students explore how the mitotic index is used in cancer studies. It is based on a study from the Journal of Veterinary Pathology which examined the mitotic index of different grades of tumors in dogs with mast cell cancer. This section requires an analysis of sample data and analyzing graphs and charts.
*New: Virtual Version of this activity uses Google Slides and images of cells undergoing Mitosis
Time Required: 50-60 minutes
Grade Level: 11-12
Part 1 Only: 9-12
HS-LS1-4 Use a model to illustrate the role of cellular division (mitosis) and differentiation in producing and maintaining complex organisms.
Yvonne Butterfield
For Part 2: How is Mitotic Index Used in Cancer Studies? What is the total # of cells?
Admin
The total number of cells depends on the counter. They scan the slide in small sections, it can vary by student. Mitotic index is a number used to determine if a sample of cells could be cancerous. A high number indicates that an abnormal number of cells are undergoing mitosis.
Ciara Cunningham
Hello, for the first part, can students use onion root tip diagram instead of slides?
Admin
I think you could, I’ve actually printed and laminated photos of onion mitosis to give to students as a follow-up. Wikimedia has a few high quality examples:
Jack
How can MI be used as a predictor for survivability for mast cell cancer?
Admin
Look at the graph of survivability function; cross reference with the graph on mitotic index and cancer grade. This is very typical of SAT/ACT questions that ask you to evaluate two graphs at one time.
Eden
What is the effect of mast cell tumor (MCT) grade on survival of a patient?
Admin
THe scatterplot and survival function graph must be combined to get the answer. Notice that that grade 1 tumors have a low mitotic index. Use that knowledge on the second graph. The low mitotic index corresponds to a higher survival rate. Now, you have to do the same analysis. What happens if the MI is high?