
Category: Worksheets
-
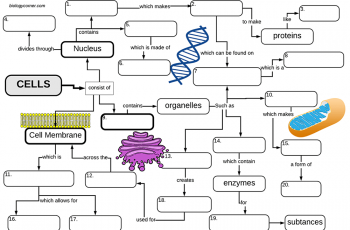
Cell Structures: A Graphic Organizer
This graphic organizer (concept map) organizes the cell structures around three main parts of the eukaryotic cell: the nucleus, cytoplasm, and cell membrane.
-
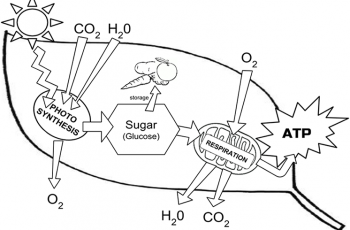
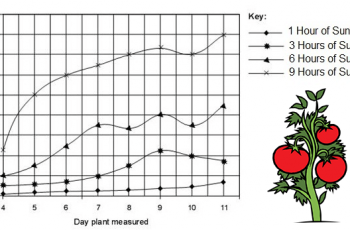
Photosynthesis Coloring
Students read short text passages and then color images to help them relate the textual information with the graphic.
-
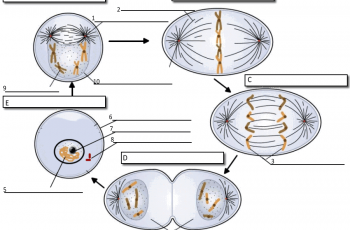
Cell Cycle Labeling
Students label the image of a cell undergoing mitosis and answer questions about the cell cycle.
-
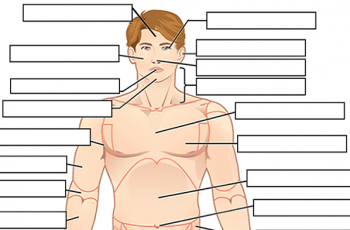
Label the Body Regions
This worksheet is used with a beginning anatomy unit that discusses anatomical terminology and body regions.
-

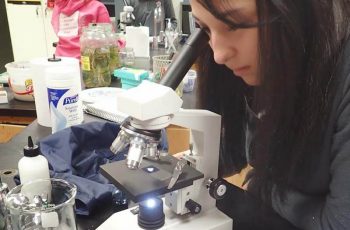
Comparing the Ameba to the Paramecium
With the adoption of NGSS, I’ve had to make cuts to some of the lessons that biology classes of the past enjoyed. I was sad to see it go, but we no longer do a unit on the Kingdom Protista, but I still manage to fit a microscope lab into other sections.
-
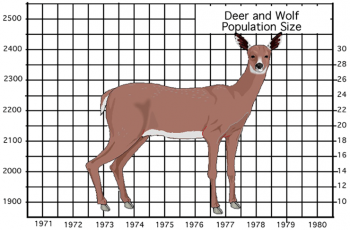
Deer: Predation or Starvation?
This activity asks students to calculate the population change (births – deaths) and then graph the number of deer and the number of wolves.
-
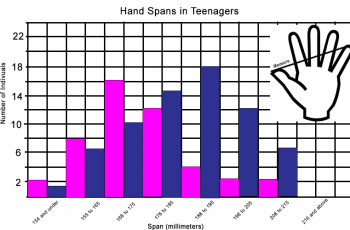
Graphing Hand Span and Height
This exercise illustrates the difference between bar graphs and scatter plots and walks students through the process of representing data they collect.
-
Data Analysis and Interpreting Graphs
Students practice analyzing pie charts, scatter plots, and bar graphs in the basic worksheet that is designed to pair with lessons on the scientific method. Most beginning biology students (in high school) are fairly adept at interpreting basic information from graphs, though scatter plots are sometimes challenging for them. I usually do this type…
-
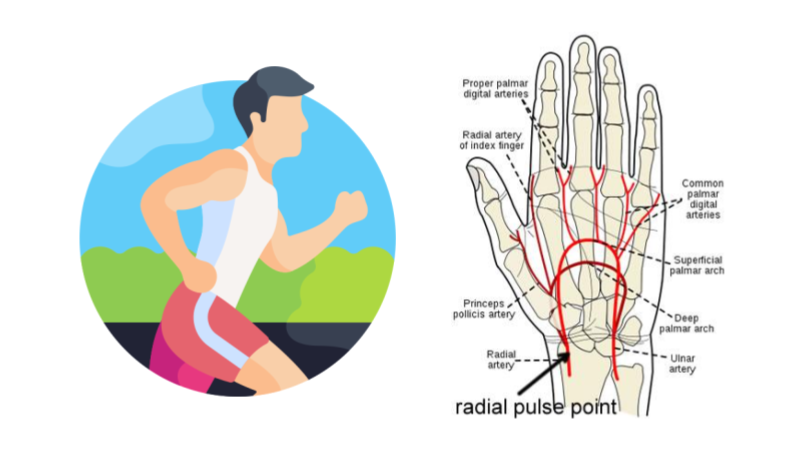
Investigation: How Does Exercise Affect Heart Rate
Design and conduct an experiment to measure the effect of exercise on heart rate. Aligned to NGSS standard on feedback mechanisms.
-

Body Systems Graphic Organizer
Graphic of the body systems where students fill in blanks about structures within the organ system and their functions. This concept map can be used as a review or as a way to organize notes over the body systems.
-
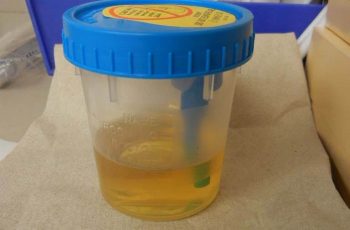
Urine Luck! – A Urinalysis Simulation
Examine urine samples from patients and suggest a diagnosis and treatment plan based on test results. Simulated urine, can be made with basic materials and models basic tests done on real urine.
-
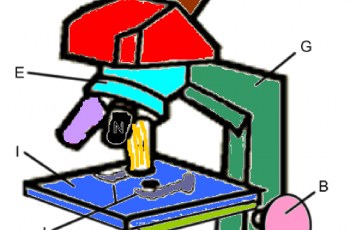
Color the Parts of a Microscope
Students read text that describe the parts and functions of the microscope and ask them to color the parts as they read.
-
Microscope Labeling
This simple worksheet pairs with a lesson on the light microscope, where beginning biology students learn the parts of the light microscope and the steps needed to focus a slide under high power.
-

Measuring Biodiversity Using Beans
Students analyze a community of beans (pinto, lima, navy) to determine the richness, abundance, and biodiversity index of two communities.
-
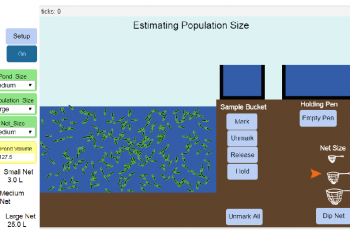
Estimating Population Size: A Netlogo Simulation
Students learn how the “mark and recapture” technique can be used to estimate population sizes by using a netlogo simulation that allows students to alter variables such as population size, and number of individuals marked.