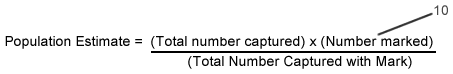
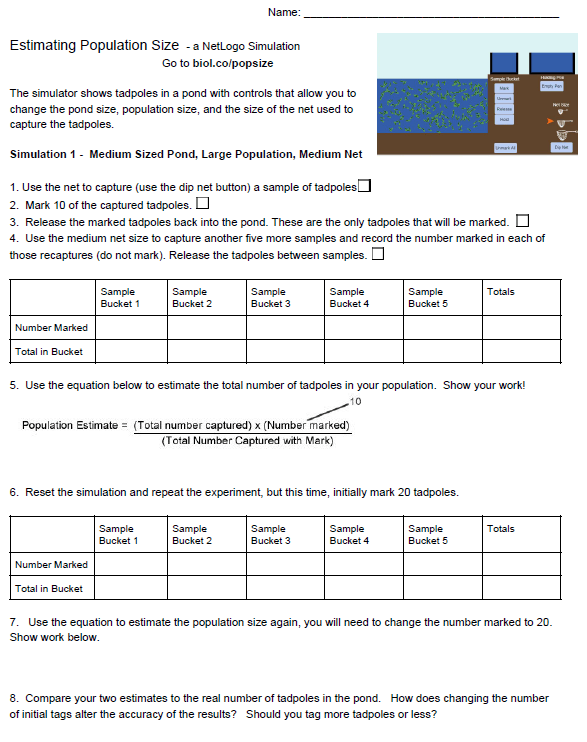
Students learn how the “mark and recapture” technique can be used to estimate population sizes. The NetLogo simulation allows the user to change the size of the pond, the population size (small, medium, large) and the size of the net used to capture samples of tadpoles. Students can mark as many as they want, but the student worksheet asks them to just mark 10 and then release. Students use the equation to then estimate the size of the tadpoles in their pond. By expanding the tab about the model, students can learn how many tadpoles are in the pond, though I usually just post the answer on the board so that they can compare their estimate from the equation to the actual population size.
Students do two simulations where they compare the accuracy of the estimate to variables they control, like the number of samples taken or how many initial tadpoles were tagged. A final application question shows students a map of Illinois and regions where rabbits live. Students must present a plan for estimating the number of rabbits in each zone.
Another investigation uses the same equation and asks students to estimate a population that is created using toys, beans, beads, or other small objects. In that lab, students must physically mark and capture the “organisms” to estimate the populations. I have used both simulations in the past, and the NetLogo simuation can be done quicker and allows more in-depth analysis about why the equation works and how changing variables can affect the accuracy of the estimate. I usually use the toys investigation with freshman and the netlogo simulation with the second year students.
[button-green url=”https://drive.google.com/drive/u/0/folders/0Bx72aSXCBO09fnVYOUNTZVk2dUxHMko4Y2FockotUzRJYXFwNWlocVFWTm03aU9zTjlUbHM” target=”_blank” position=”none”]Download PDF[/button-green] [button-blue url=”https://docs.google.com/document/d/1ePR_PIWQlhzYp27UHNX_3UmXEp6HInQKfchnOFlPnWo/edit?usp=sharing” target=”_blank” position=”none”]Google Doc[/button-blue]
HS-LS2-1 Use mathematical and/or computational representations to support explanations of factors that affect carrying capacity of ecosystems at different scales.
CCC3: Scale, proportion, and quantity. In considering phenomena, it is critical to recognize what is relevant at different measures of size, time, and energy and to recognize how changes in scale, proportion, or quantity affect a system’s structure or performance.
Jen Heck
Hi! Thanks for sharing. This is such a cool simulation. I’ve been wanting to try this (and the vole) activity. I think I’ve determined the vole population (have to dig that one out my files). Any chance you could share the fish population with me? I haven’t been able to calculate it but would love to do this activity with my APES students.
Admin
The details for pond size and population size are in the “Model Info” tab of the simulation. http://virtualbiologylab.org/NetWebHTML_FilesJan2016/PopulationEstimationModel.html
Sindi Holman
Are you going to fix the flash Rabbits Mark-Recapture simulation? We loved using this one in our classes. Please redo it, pretty please!
Sindi Holman
Oh here is the rabbit simulation I’m talking about
https://www.biologycorner.com/flash/mark_recap.swf
Admin
Unfortunately, all the flash animations across the entire internet will no longer work. Flash was deplatformed by the all of the browsers (Google, Apple, etc.)
Sindi Holman
I know that flash was removed. Are you going to make a version that will work? We (teachers) relied on this simulation for teaching mark-recapture and this was one of the best ones and easiest to understand out there.
Admin
The netlogo activity isn’t flash, but it does use a version of javascript that might not work on all devices. I’ve never tested it on ipads. I don’t make these simulations, it is way outside my area of expertise.
Hillary
Can you make an html version of the lab? Java script does not work on chromebooks
Admin
I didn’t create that program. I wouldn’t even know where to start! I wonder if there’s an app that can be added to chromebooks to make java run.