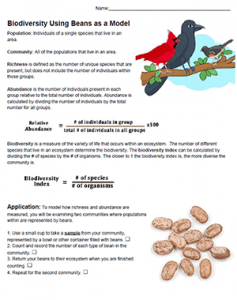
Students analyze a community of beans (pinto, lima, navy) to determine the richness, abundance, and biodiversity index of two communities. The communities are set up in advance, just place bags of beans into a large bowl or bucket, and then have students use a small cup to model sampling.
After counting the number of each type of bean, students record data on a table and determine the relative abundance of each “species” of bean.
Student will then use an equation to establish the biodiversity index.
A biodiversity index is a quantitative measure that reflects how many different species there are in a community. In short, it is a measure of species diversity in an area. If the index is high, that represents a community with a wide variety of different species.
In the discussion section, students explain why one community has a higher index than the other. They explain why different groups obtained different results (sampling errors). Discussion follows regarding why the biodiversity index might be important to ecologists who study forests and other ecosystems.
Grade Level: 9-12
Time Required: 20-30 minutes + discussion
HS-LS2-2 Use mathematical representations to support and revise explanations based on evidence about factors affecting biodiversity and populations in ecosystems of different scales.

