
Search results for: “system”
-
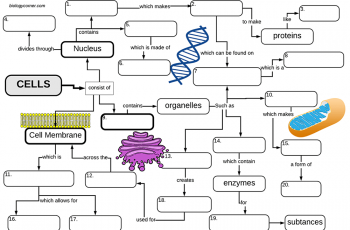
Cell Structures: A Graphic Organizer
This graphic organizer (concept map) organizes the cell structures around three main parts of the eukaryotic cell: the nucleus, cytoplasm, and cell membrane.
-
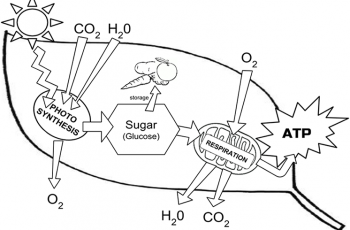
Photosynthesis Coloring
Students read short text passages and then color images to help them relate the textual information with the graphic.
-
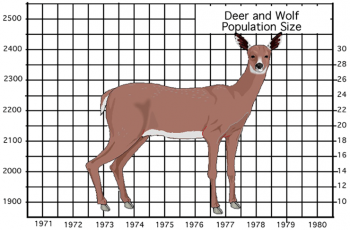
Deer: Predation or Starvation?
This activity asks students to calculate the population change (births – deaths) and then graph the number of deer and the number of wolves.
-
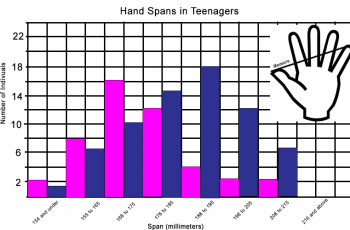
Graphing Hand Span and Height
This exercise illustrates the difference between bar graphs and scatter plots and walks students through the process of representing data they collect.
-
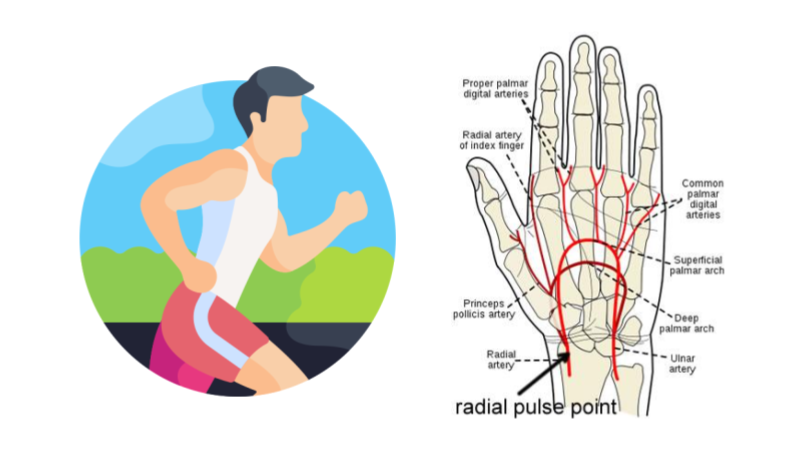
Investigation: How Does Exercise Affect Heart Rate
Design and conduct an experiment to measure the effect of exercise on heart rate. Aligned to NGSS standard on feedback mechanisms.
-

Measuring Biodiversity Using Beans
Students analyze a community of beans (pinto, lima, navy) to determine the richness, abundance, and biodiversity index of two communities.
-
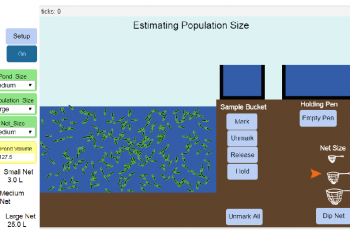
Estimating Population Size: A Netlogo Simulation
Students learn how the “mark and recapture” technique can be used to estimate population sizes by using a netlogo simulation that allows students to alter variables such as population size, and number of individuals marked.
-
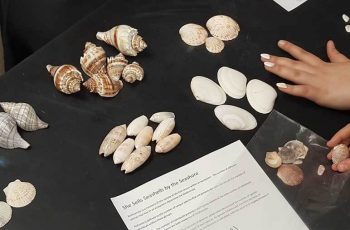
Calculate the Biodiversity Index of a Beach
This activity asks students to sort seashells and calculate the Simpson’s biodiversity index. The calculation is based on the number species in an area, dependent upon richness (number of unique species) and abundance (number of individual species).
-
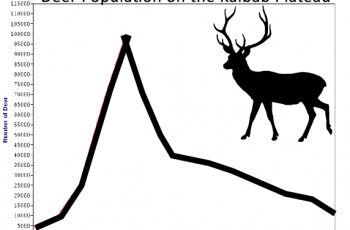
The Lesson of the Kaibab
This activity asks students to graph the number of kaibab deer on the plateau after predators were removed, then analyze data and develop a better plan.