
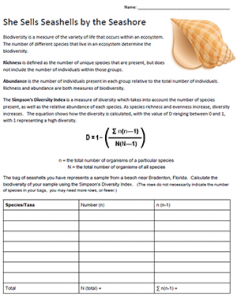
Students sort seashells and calculate the Simpson’s biodiversity index in this activity. Students then determine the overall diversity of the beach based on the index number. If their sample contains a wide variety of shells, then the index will be higher!
The calculation is based on the number species in an area. It also depends upon richness (number of unique species) and abundance (number of individual species). Lessons I have used in the past use the same calculations but require students to use a sample of beans, where samples have been provided that include a variable number of pinto beans, Lima beans, and other assorted beans.
The shell activity also provides student the opportunity to explore different shell patterns and match them to the organism. While it is not required, my students were curious about the names of the shells, they were able to identify calico scallops, conch shells, and lightning whelk shells by using the Florida Shell Guide.
I acquired my shells from a lamp that my grandmother had constructed after years of collecting shells at Bradenton Beach in Florida. You can purchase shells from Amazon or collect them yourself. You could also use beans or other objects to create an artificial ecosystem where students could practice applying the equation.
Grade Level: 11-12
Time Required: 20-30 minutes
NGSS Science and Engineering Practices: 4. Analyzing and interpreting data 5. Using mathematics and computational thinking 6. Constructing explanations
CCC – 1. Patterns. Observed patterns of forms and events guide organization and classification, and they prompt questions about relationships and the factors that influence them.