
Category: Worksheets
-
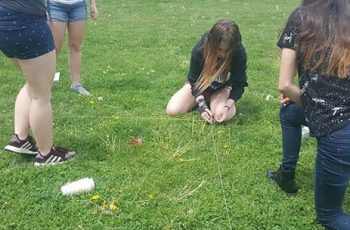
Random Sampling
Students model how field biologists would use a sampling technique to estimate the number of sunflowers in a field. First, they choose 10 plots at random by choosing paper slips, then take the average of those plots. The worksheet walks them through the steps of then using the average and the overall size of the…
-
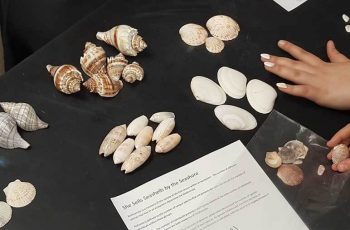
Calculate the Biodiversity Index of a Beach
This activity asks students to sort seashells and calculate the Simpson’s biodiversity index. The calculation is based on the number species in an area, dependent upon richness (number of unique species) and abundance (number of individual species).
-
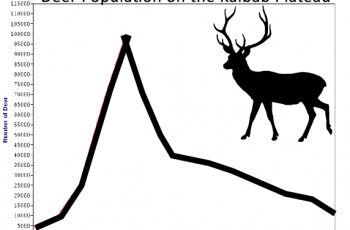
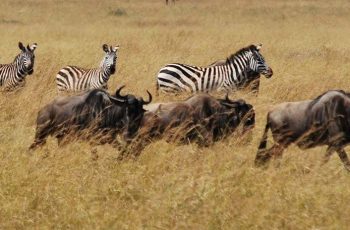
The Lesson of the Kaibab
This activity asks students to graph the number of kaibab deer on the plateau after predators were removed, then analyze data and develop a better plan.
-
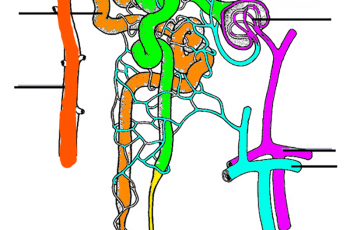
Color and Label the Nephron
Practice labeling the nephron with this reinforcement activity. Students can also color the image to identify the major structures of the nephron: glomerulus, bowman’s capsule, proximal and distal tubules, loop of Henle, collecting duct and capillaries. This was designed to go with a larger unit on how the urinary system and kidneys help the body…
-
Niche Partitioning – Gorongosa Phenomenon
Explore niche partitioning in Gorongosa with this interactive graph and activity.
-
Ecology Lesson on Trophic Cascades
This year I decided to change the way I teach the last unit of the year, which is ecology. Our textbook is really old, and not aligned to NGSS. The lessons followed a familiar “old-school” pattern: take notes mainly about definitions, do an activity or lab, then take a quiz. This year, I wanted to…
-
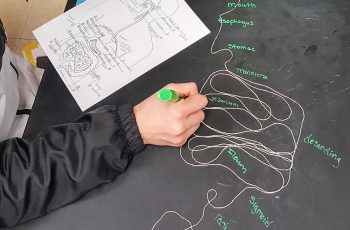
Modeling the Alimentary Canal
In this activity, students use string to model the gastrointestinal tract as a scale model. I’ve noticed that students do have difficulty with the concept of scaling, which is one of the crosscutting concepts listed in the NGSS. The directions give students measurements for a 1/3 scale model, the human alimentary canal is about 9…
-
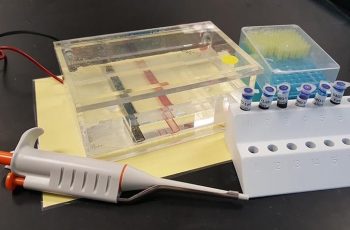
Investigation: Gel Electrophoresis and DNA
This procedural lab is a great compliment for genetic studies where students learn about sex linked genes and mutations. The allele for Duchenne Muscular Dystrophy is located on the X chromosome and is associated with a deletion mutation for that region.
-

Case Study: How Do Tibetans Survive High Altitudes
Based on the Berkeley website: Understanding Evolution, this version focuses on the how the body maintains homeostasis at high altitudes. This involves increased production of red blood cells to improve oxygen supplies to tissues. Tibetan populations have adapted to high altitudes by producing fewer red blood cells which improves fetal mortality rates. Case looks…
-
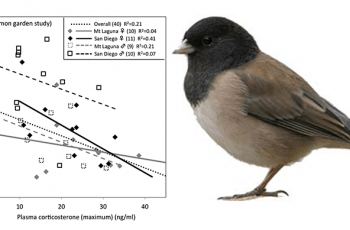
Data Analysis: Funky Juncos
View a short video about how a group of birds split from the main population and evolved in relative isolation near a college campus. The film is is 88 minutes long and all of its parts can be viewed at the Juncoproject.com, though for this activity, only one 16 minute chapter is viewed. The…
-
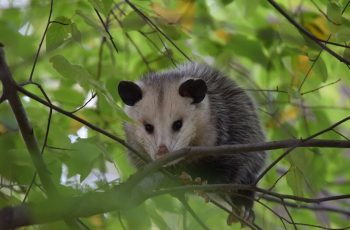
Data Analysis: Virginia Opossum and Color Variations
Students examine scatter plots that show phenotype variations among opossums in North America, exhibiting variations in coat color, ear length, and size.
-
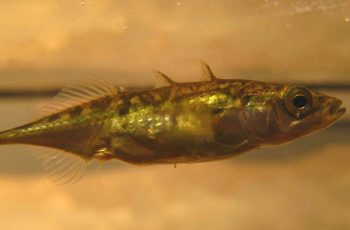
Investigation: Gene Switches in Stickleback Fish
This activity was modified from HHMI’s “Modeling the Regulatory Switches of the Pitx1 Gene in Stickleback Fish” The activity is presented as a type of investigation or case study where students examine regulatory switches and was a short film that describes the role of the Pitx1 gene in the development of spines. Students can work…
-
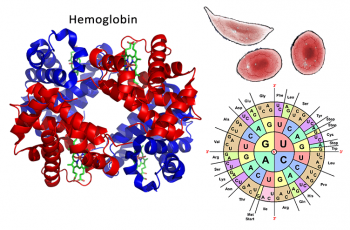
DNA, Proteins, and Sickle Cell
In this activity, students use a codon chart to compare the DNA sequence of HbA (normal hemoglobin) to HbS (sickle cell). The DNA differs in a single base, where the codon for normal hemoglobin codes for glutamine, and the mutant form codes for valine.
-
Dog SNPs and Curly Hair
In an effort to add more real data to the DNA (genetics) unit, I added a shortened form of the HHMI activity: “Mapping Genes to Traits in Dogs Using SNPs” The activity on HHMI is too advanced for freshman level biology, but I thought it would be a good introduction to DNA sequences. The activity…
-
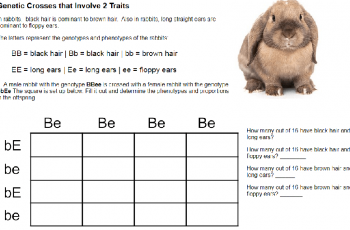
Genetic Crosses with 2 Traits with Rabbits
Beginning biology students can struggle with dihybrid crosses and setting up Punnett squares that have two traits. When tackling this concept, make sure students are familiar and competent with basic genetic crosses and setting up Punnett squares for a single trait. For example, a tall (Tt) plant is crossed with a short plant (tt). Once…