
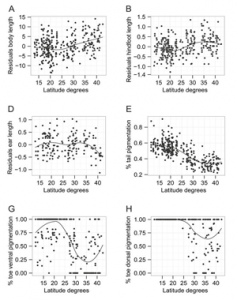
This activity is designed to help students examine scatter plots that show phenotype variations among opossums in North America. Data was taken from a peer reviewed article “Playing by the Rules? Phenotypic adaptation to temperate environments“
The entire article is too detailed for my students. Instead, I have them examine each graph and determine which variations seem to be correlated with latitude. The scatterplots show several variations across latitude. For example, tail pigmentation, tail length, and rostrum lightness.
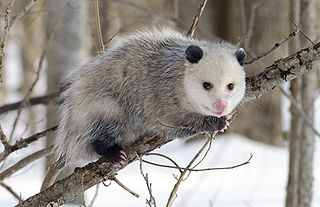
The opossum in the photo below is found in northern latitudes. Notice the lightness of the face and rostrum (nose). Opossums in southern latitudes are more likely to be darker in color.
There’s also room for discussion about what a marsupial is and why opossums are the only marsupials native to North America. Students can then read the abstract and compare the researcher’s findings to their own analysis.
The abstract also contains references to Gloger’s, Allen’s, and Bergmann’s rules about how phenotypes change as you move farther north (shorter extremities, lighter fur, larger size). Definitions and discussion are included on the slides with an extension question about human variation and latitude.
The google doc contains the graphs and the abstract. The google slides that can be used for discussion points along the way, and also contains photos of opossums, opossum ranges in north America, and rabbits that show evidence of Allen’s rule.
Grade Level: 11-12
Time Required: 20-30 minutes
HS-LS4-3 – Apply concepts of statistics and probability to support explanations that organisms with an advantageous heritable trait tend to increase in proportion to organisms lacking this trait.
HS-LS4-4 – Construct an explanation based on evidence for how natural selection leads to adaptation of populations.