
This year I decided to change the way I teach the last unit of the year, which is ecology. Our textbook is really old, and not aligned to NGSS. The lessons followed a familiar “old-school” pattern: take notes mainly about definitions, do an activity or lab, then take a quiz. This year, I wanted to start developing some phenomenon based lessons that start with interesting observations and build student understanding from those real-world observations.
HHMI has some amazing ecology lessons, including lessons based on trophic cascades. Since students love otters, I started out with a question and an image of sea otters. “What determines how many species live in a given place? And, what determines how large each population can grow?”
At first, we had a class discussion about otters, where students informed me that otters have a favorite rock, and we came up with ideas about what would determine how many otters could live in an area? HHMI has a short film on tropic cascades (19 minutes) that includes information about the sea otter and keystone species. There is a students handout/quiz that goes with the film, but I thought it was too much detail for the freshman class.
Instead, I asked students to take notes on the film, focusing on the following terms:
1) Green World Hypothesis
2) Keystone Species
3) Trophic Cascades
4) Hypothesis and experimentation
Film: Some Animals Are More Equal than Others: Keystone Species and Trophic Cascades
There were a couple of places where I paused the film and to help students understand key points. A final discussion with small groups asks students to create a food web of the area where the otters live. Most students have some experience with food webs, but their conceptual understanding may not be complete. For example, many put the arrows in the wrong direction, or forget to include producers.
The slides and discussion continue to allow students to fill in the gaps of their understanding about food webs, trophic cascades, and how energy flows through ecosystems, all anchored in the original phenomenon of the otters, sea urchins, and kelp.
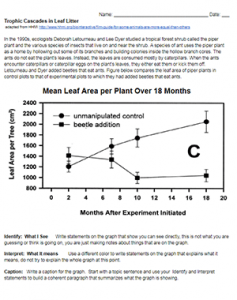
Finally, students are asked to apply this knowledge to another example, a graph (also provided by HHMI) that looks at trophic cascades in leaf litter. This graph was originally part of the film guide worksheet, but I extracted it to use as a stand alone assessment. Students used the I2 strategy to interpret the graph and apply what they have learned. HHMI also has a Trophic Cascade Click and Learn that explores other ecosystem trophic cascades.
Time Required: 45-60 minutes
Grade Level: 9-12
HS-LS2-2 Use mathematical representations to support and revise explanations based on evidence about factors affecting biodiversity and populations in ecosystems of different scales.
HS-LS2-6 Evaluate the claims, evidence, and reasoning that the complex interactions in ecosystems maintain relatively consistent numbers and types of organisms in stable conditions, but changing conditions may result in a new ecosystem