
Tag: ecology
-
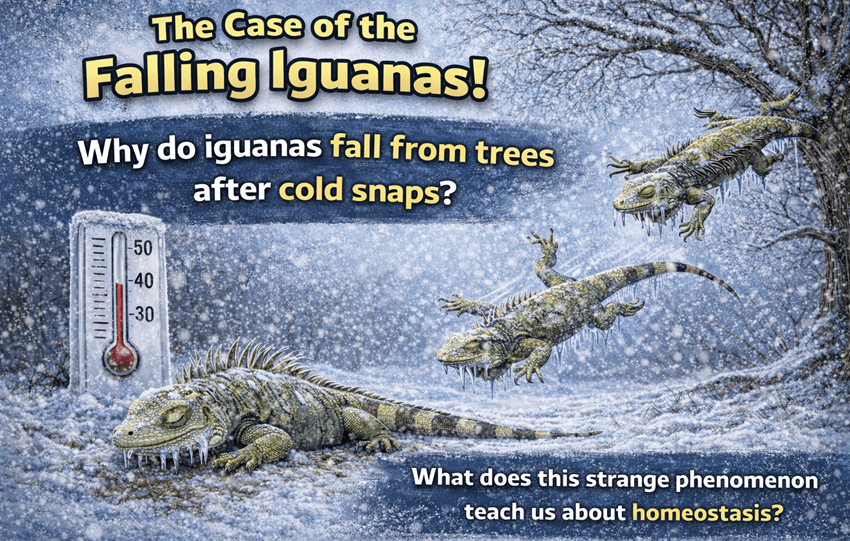
A Chilling Case Study – Raining Iguanas
Engage your students with a real-world, biology-based phenomenon: Florida’s “raining iguanas.” During sudden cold snaps, iguanas lose muscle control and fall from trees, providing a dramatic example of ectothermy, torpor, and homeostasis. This case study combines observation, data interpretation, and critical thinking to help students connect behavior, physiology, and environmental influences. Students can complete this…
-
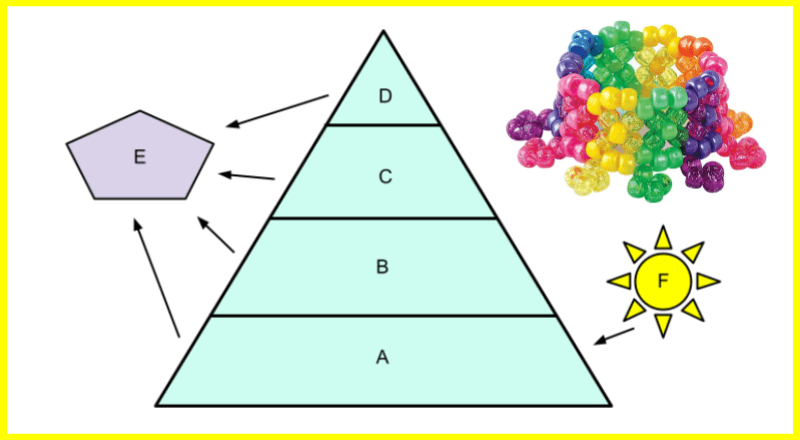
Modeling Ecological Pyramids
Looking for a way to include hands-on activities in an ecology unit? I’ve struggled with student engagement in this unit, mainly because so many of the concepts involve models. In this activity, students use beads to model the three types of ecological pyramids: pyramid of numbers, pyramid of biomass, and pyramid of energy. Each group…
-
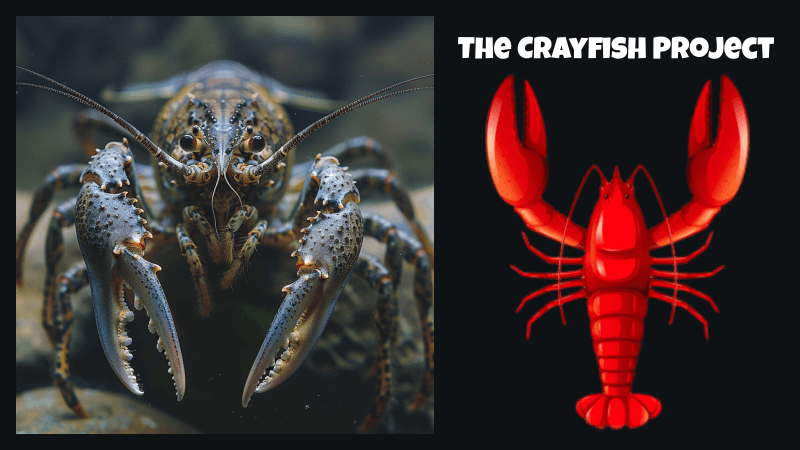
The Crayfish Project – Ecology and Anatomy
Student project on crayfish which includes learning about crayfish ecology, invasive species, and food webs. Dissect a crayfish specimen to learn anatomy!
-

Interpreting a Food Web and Trophic Levels
Students analyze a food web and determine the types of consumers, herbivores, carnivores, and omnivores. Then they construct a pyramid of numbers.
-
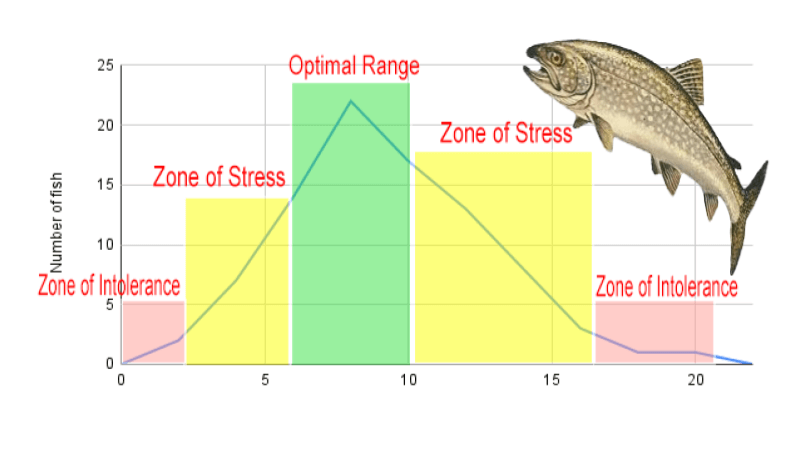
Exploring Range of Tolerance in Steelhead Trout
Students learn about the range of tolerance by graphing the number of trout found at different temperatures in a stream. Includes analysis questions.
-
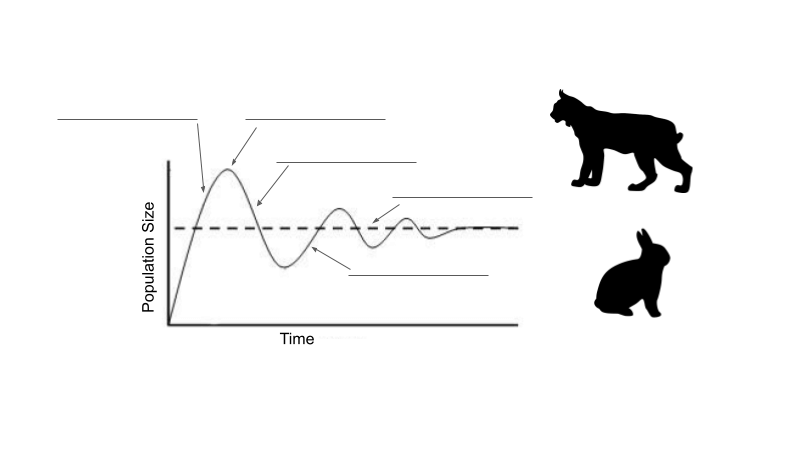
Explore Limiting Factors and Carrying Capacity
Explore how limiting factors affect population growth. Students learn the definition of a limiting factor and apply it to several scenarios.
-
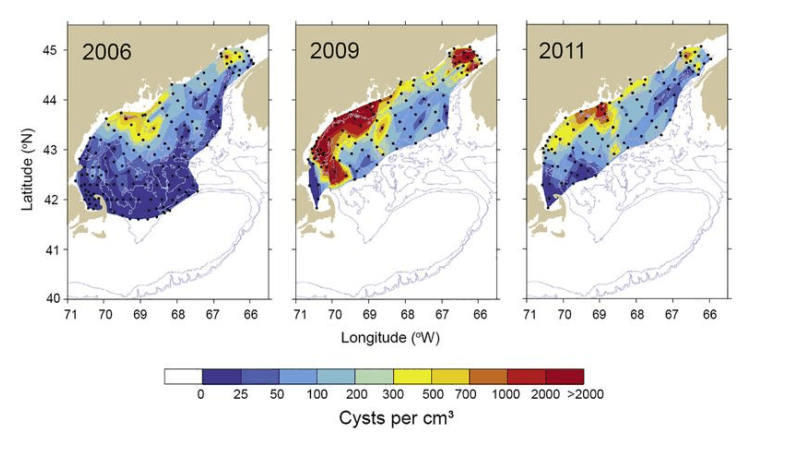
Investigating Algae Blooms and Dinoflagellates
Explore data on algae blooms by creating a heat map revealing changes in algae over time. Discuss the role that humans have on algae growth.
-
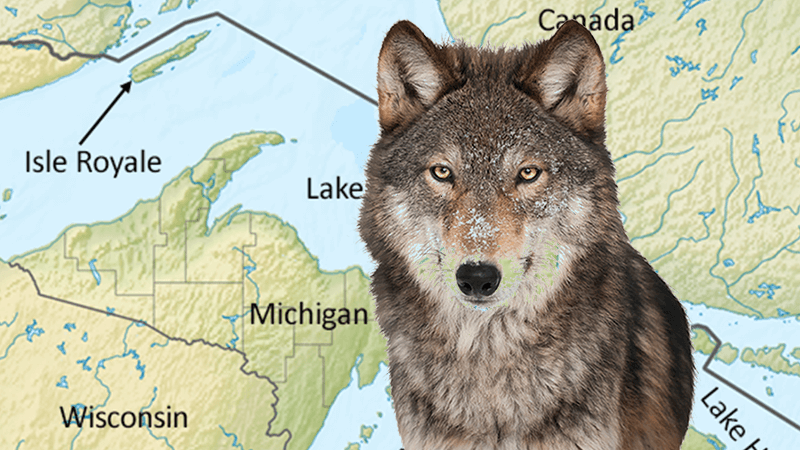
Ecology Case Study – The Wolves of Isle Royale
Case study explores the interactions of wolves and moose on Isle Royale. Students examine data on population growth and spinal deformities caused by inbreeding.
-
Case Study – How Human Activities Affect Water Quality
Use the data to determine where a river is most polluted, and determine what factors affect the composition of the water, like locations near towns or farms.
-
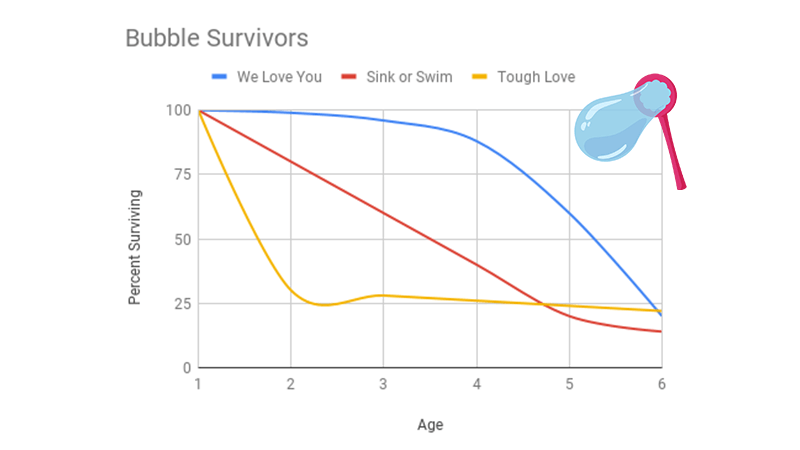
Modeling Survivorship Curves with Bubbles
A fun activity to model survivorship curves using bubbles. Students blow bubbles and time how long each survive under different conditions, then create a graph.
-
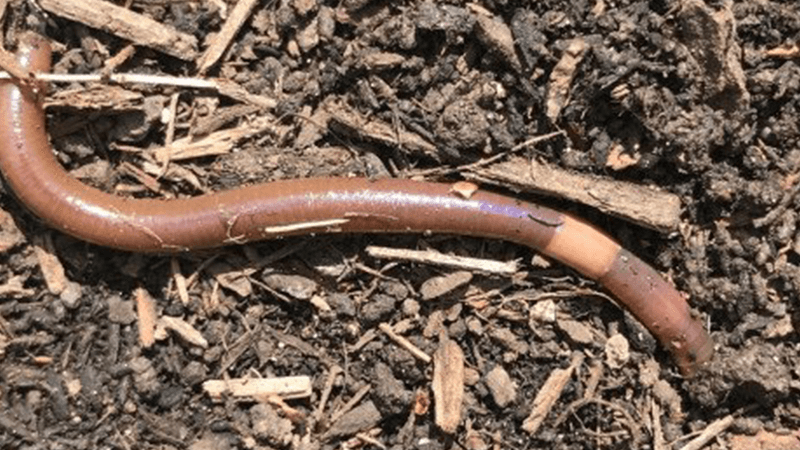
Data Analysis – Invasion of the Jumping Worms
Lesson plan uses the 5E model to explore the invasive Asian Jumping Worm and its impact on soil and forests; includes data analysis.
-
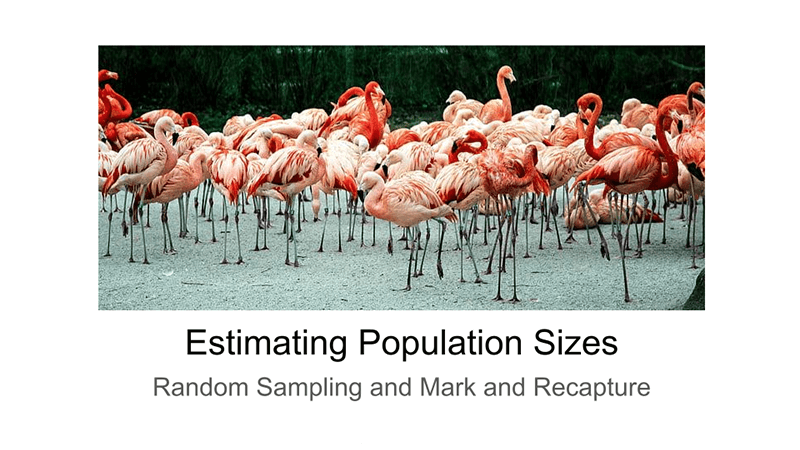
Estimating Population Size – Remote Learning Unit
Population growth studies are a common element to studies in ecology in my basic biology class. Students learn about exponential and logistic growth the impacts populations have on the environment. As part of this unit, I have had students simulate techniques used to estimate the size of a populations. I have toys packed in bags…
-
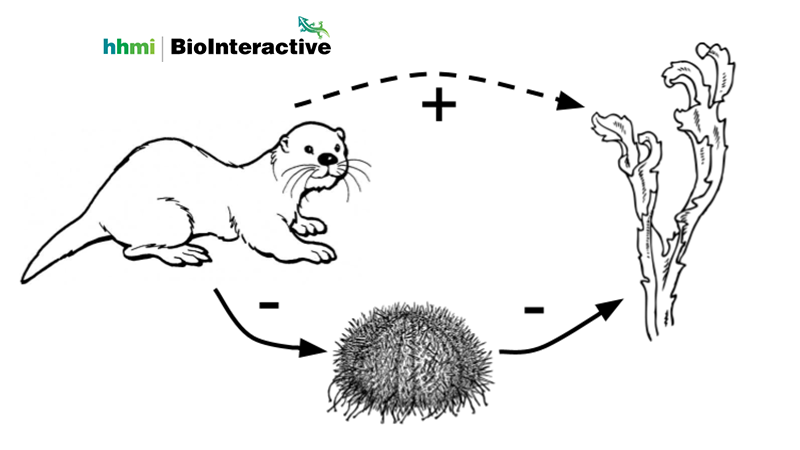
Trophic Cascades at Biointeractive
This worksheet is designed for the Interactive Activity on Trophic Cascades at HHMI Biointeractive . Students learn how the loss or addition of a species, like a fox, can affect other organisms in the system. Students complete the worksheet by answering questions as they explore the interactive activity. The activity illustrates a trophic cascade in…
-
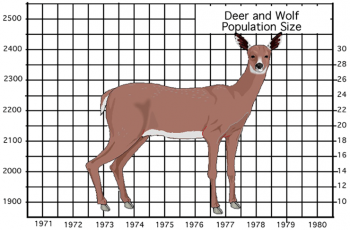
Deer: Predation or Starvation?
This activity asks students to calculate the population change (births – deaths) and then graph the number of deer and the number of wolves.
-
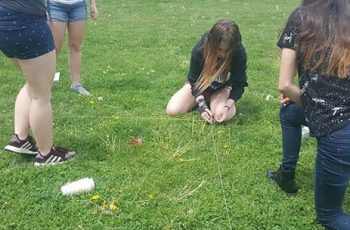
Random Sampling
Students model how field biologists would use a sampling technique to estimate the number of sunflowers in a field. First, they choose 10 plots at random by choosing paper slips, then take the average of those plots. The worksheet walks them through the steps of then using the average and the overall size of the…