
Most ecology units start with the biosphere and explore how biomes are distributed across the earth. Students learn how temperature and rainfall affect the types of plants and animals that inhabit those ecosystems. They also complete a worksheet where they color the biomes of North America.
Aquatic ecosystems are part of this unit, and considering that the earth is mostly water, and entire class could focus on oceans and freshwater biomes. With limited time, a basic biology, I usually focus on ecology issues related to these ecosystems, such as biodiversity loss and water pollution.
To explore algae blooms, I adapted this activity from NIH – Harmful Algae Blooms: Track them like a scientist.
Think Like a Scientist
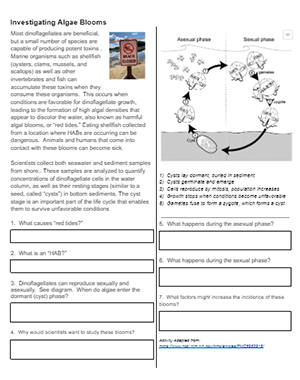
In this activity, students explore data on algae blooms. It starts with a description of algae blooms and the impacts on wildlife. To introduce the topic, show students images of algae blooms or news articles where beaches have been closed. Students then examine the life cycle of a dinoflagellate, reviewing asexual and sexual reproduction. These organisms can form a cyst that can lie dormant until conditions are right for growth.
Next, students create a heat map of algae blooms from collected data. This can be challenging for students at first, so you may want to model how to color the map. Assign each group to map a different year, so that you will have three maps that students compare later.
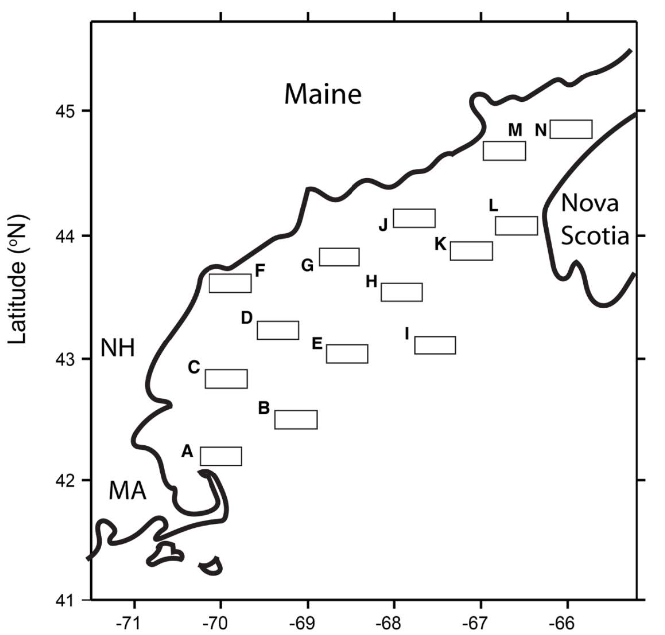
The maps have blank areas, labeled with letters. Students use the colored pencils to shade the areas according to the level of algae at each site. This creates a type of “heat” map showing areas with algae blooms. They will be able to see that some sites are impacted more than others
Once the maps are complete, students answer questions about how algae blooms change over time (2006-2011). The instructor provides a completed map for a comparison. They should notice that certain areas have higher rates of bloom. Then they can propose reasoning for why some areas are more susceptible.
Finally, students create a line graph for additional plots. The goal is for students to observe trends and discuss what factors affect algae blooms. Ideally, students will work in small groups where you can circulate and prompt discussion.