
The range of tolerance describes the abiotic factors that limit populations in an ecosystem. Organisms can only survive within a certain range of conditions, like temperature, oxygen, and water. At the optimal range, the organism can survive and reproduce. Outside the optimal range, the animal experiences stress, or cannot survive at all.
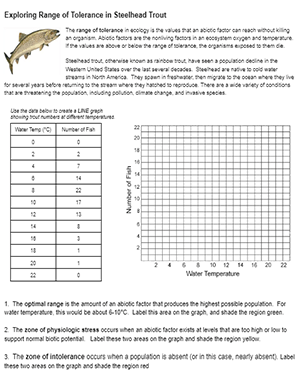
In this activity, students graph the number of steelhead trout at different water temperatures. The trout have the highest numbers between 6 and 10 degrees (optimal) range. They label and color code the graph to show the conditions where the trout can thrive and where it experiences stress and intolerance.
In the second section, students examine a graph that shows the optimal range for dissolved oxygen. They label the optimal range, zone of physiological stress, and zones of intolerance. Both graphs show a clear “peak” where the fish are living in optimal conditions.
Finally, students answer several analysis questions about how this information could be used to understand climate change and population decline. Trout can also serve as an indicator species, providing clues to the health of the overall ecosystem.
This activity pairs well with the case study on Human Activities and Water Quality where students analyze data taken from several sites along a river. They discover that pollution can affect the number and types of organisms that live in the water.
This activity pairs well with the case study on Human Activities and Water Quality where students analyze data taken from several sites along a river. They discover that pollution can affect the number and types of organisms that live in the water.