
Search results for: “science graph”
-
Investigation: How Do Enzymes Work?
This lab is fairly basic, but when given with guided instruction how enzymes catalyze reactions, students can have a hands-on experience into how proteins are related to function.
-
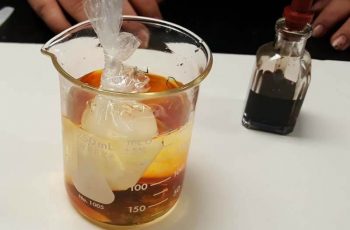
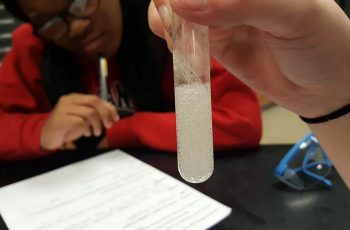
Investigation: How Can Diffusion Be Observed?
This investigation provides a hands-on way to observe what happens when a chemical moves across a semipermeable membrane. In this case, a cheap plastic bag serves as a model for the cell membrane and shows that iodine will move into the bag and turn the contents purple.
-
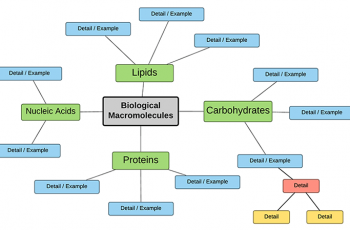
Create a Concept Map of Biomolecules
This activity asks students to work in groups to create a concept map (graphic organizer) on the biological macromolecules: carbohydrates, lipids, fats, and nucleic acids. Students are given brief instructions and a sample map to get them started, but they are responsible for determining what details are important in each section.
-
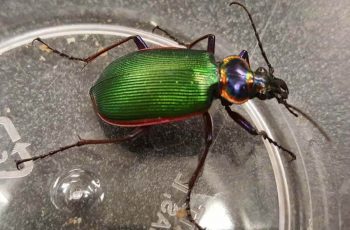
Investigation: How Do Insects Move?
Have you ever thought about how insects with 6 legs actually crawl? Human movement on two legs is pretty simple: left-right-left-right, but all insects have 6 legs attached to a thorax. In this activity, I ask students to observe an insect closely, usually a dubia roach.
-
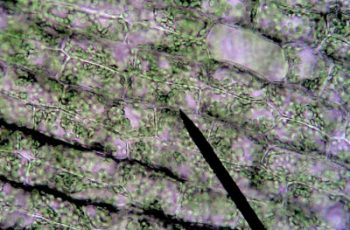
Using Anchoring Phenomenon with Lessons
Start lessons on osmosis with an activity and anchoring phenomenon. View cells exposed to salt and observe how they change!
-
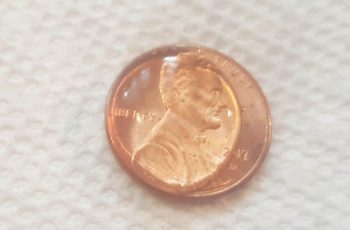
Penny Lab: Soap and Surface Tension
Most science classes begin the year with an exercise on the scientific method. It can be difficult to plan a short activity that will reinforce the main ideas of developing and testing a hypothesis. This lab is simple and doesn’t require much in the way of materials: pennies, water, and pipettes (and paper towels for…
-
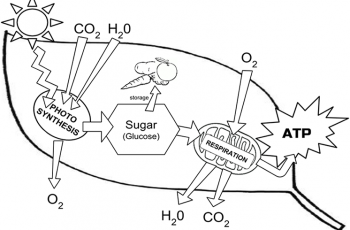
Photosynthesis Coloring
Students read short text passages and then color images to help them relate the textual information with the graphic.
-
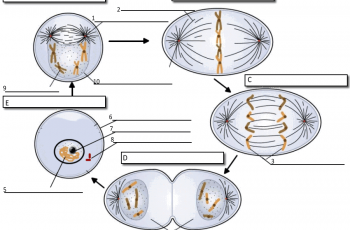
Cell Cycle Labeling
Students label the image of a cell undergoing mitosis and answer questions about the cell cycle.
-
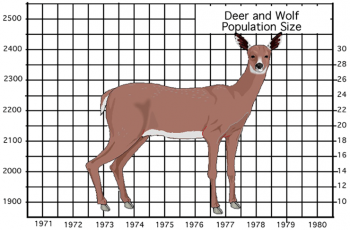
Deer: Predation or Starvation?
This activity asks students to calculate the population change (births – deaths) and then graph the number of deer and the number of wolves.
-
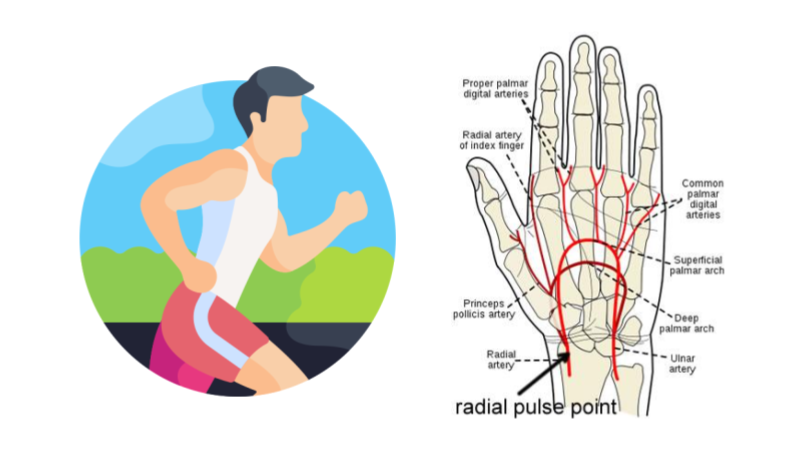
Investigation: How Does Exercise Affect Heart Rate
Design and conduct an experiment to measure the effect of exercise on heart rate. Aligned to NGSS standard on feedback mechanisms.
-
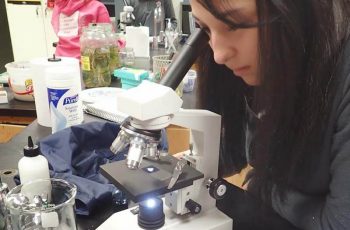
Microscope Labeling
This simple worksheet pairs with a lesson on the light microscope, where beginning biology students learn the parts of the light microscope and the steps needed to focus a slide under high power.
-

Measuring Biodiversity Using Beans
Students analyze a community of beans (pinto, lima, navy) to determine the richness, abundance, and biodiversity index of two communities.
-
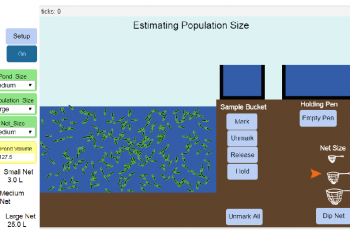
Estimating Population Size: A Netlogo Simulation
Students learn how the “mark and recapture” technique can be used to estimate population sizes by using a netlogo simulation that allows students to alter variables such as population size, and number of individuals marked.
-
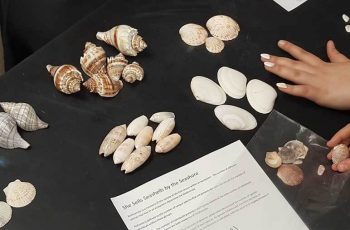
Calculate the Biodiversity Index of a Beach
This activity asks students to sort seashells and calculate the Simpson’s biodiversity index. The calculation is based on the number species in an area, dependent upon richness (number of unique species) and abundance (number of individual species).
-
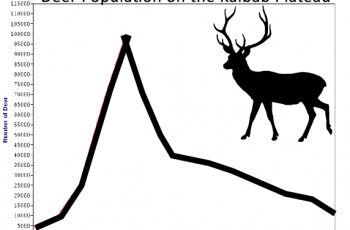
The Lesson of the Kaibab
This activity asks students to graph the number of kaibab deer on the plateau after predators were removed, then analyze data and develop a better plan.