
Search results for: “science graph”
-
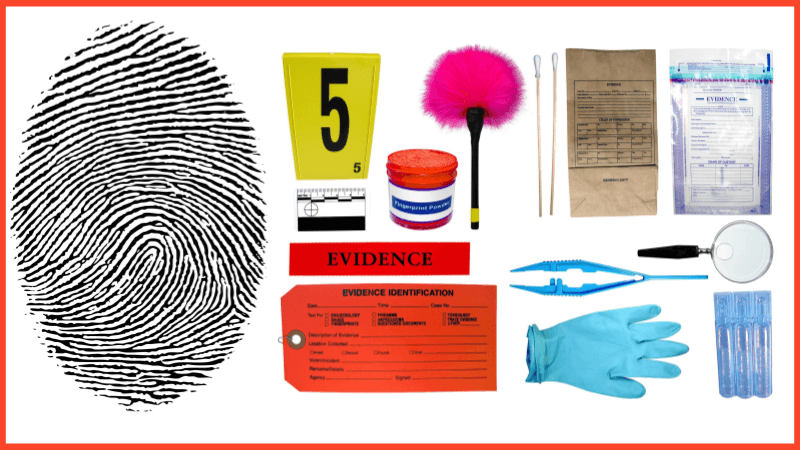
Science of Fingerprints: A Hands-On Activity
Fingerprint analysis is a fascinating way to explore individuality and forensic science. A lesson on this topic begins with an introduction to fingerprints, explaining their uniqueness and role in forensic investigations. Use Google slides to show students the science of fingerprinting. It covers the three main fingerprint patterns—loops, whorls, and arches—using clear diagrams and descriptions…
-
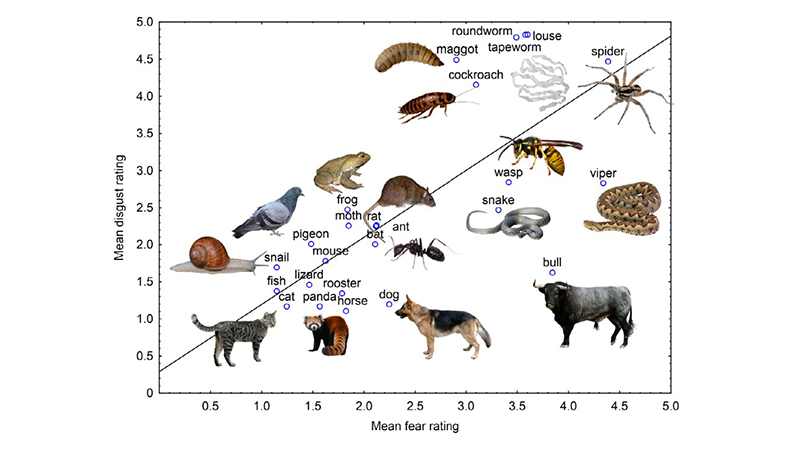
Spooky Science – Data Analysis on Fear and Disgust
Students explore what animals elicit feelings of disgust or fear. They analyze a graph and suggest evolutionary reasons for fear.
-

Analyze Data and Create a Climate Graph
Students practice analyzing climate graphs of four regions in the United States. Answer simple questions and create a graph from data collected in Germany.
-
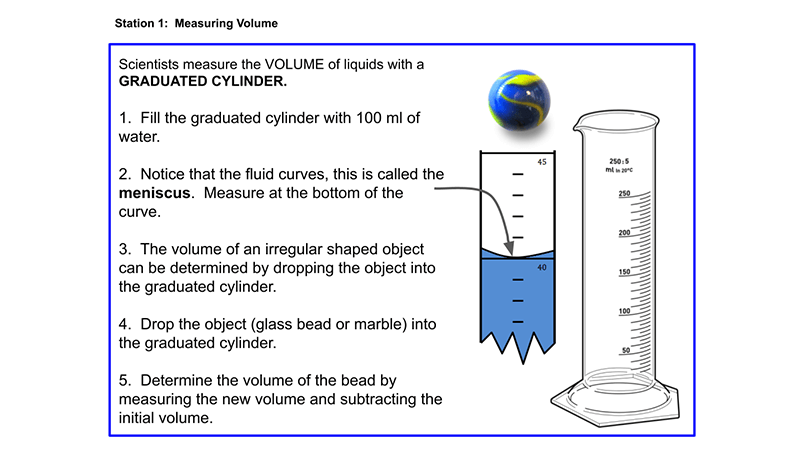
Introductory Activity on Using Science Equipment
Learn to use scientific tools in this station activity. Determine volume, length, temperature, and mass by visiting stations in the lab and performing tasks.
-
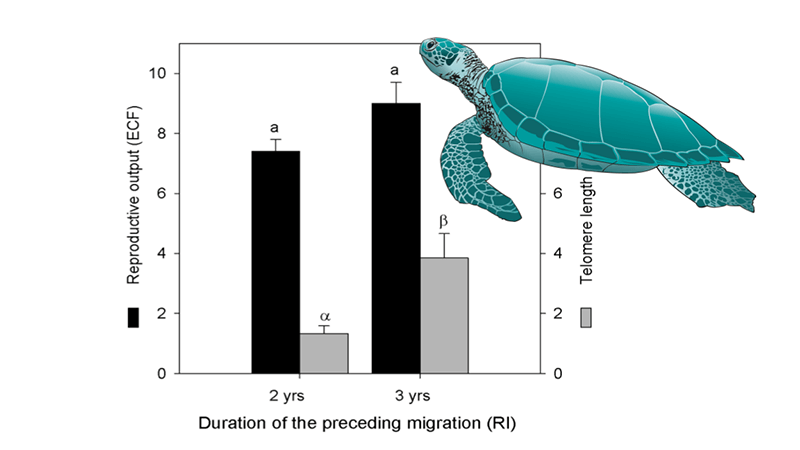
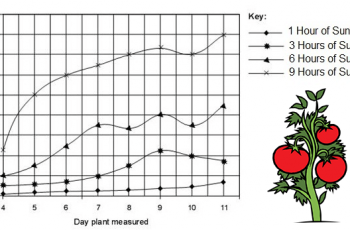
Analyzing a Turtle Graph from Primary Source
Examine data on turtle reproduction and migration. Annotate graphs and develop a claim; use reasoning to support that claim with data.
-
Early Discoveries in Science – Remote Version
Remote version of early discoveries in science. Slides present scenarios about how the scientific method is used to solve real-world problems.
-
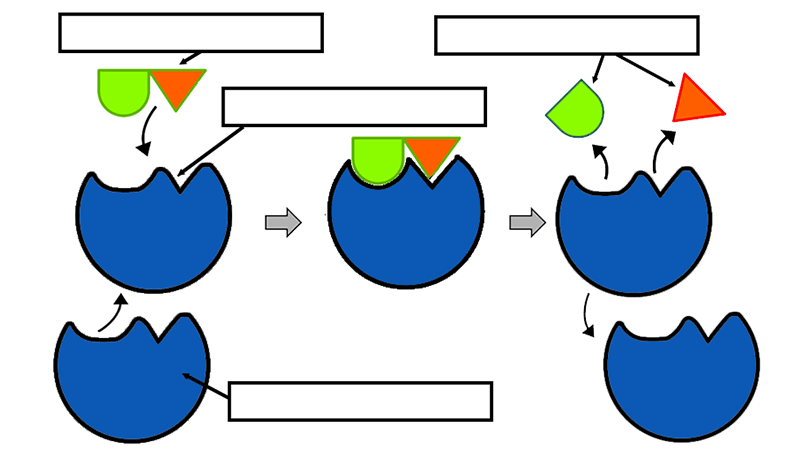
Exploring Enzymes by Analyzing Graphics
Students examine several images related to enzymes and answer questions. Worksheet covers how enzymes act on substrates, how they lower the activation energy of a reaction, how they have optimal temperature and pH, and how they can be inhibited.
-
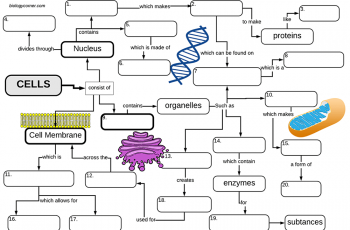
Cell Structures: A Graphic Organizer
This graphic organizer (concept map) organizes the cell structures around three main parts of the eukaryotic cell: the nucleus, cytoplasm, and cell membrane.
-
Science News Articles for Kids
Are you looking for current science for your students? This is a list of go-to sources for reliable science news.
-
Data Analysis and Interpreting Graphs
Students practice analyzing pie charts, scatter plots, and bar graphs in the basic worksheet that is designed to pair with lessons on the scientific method. Most beginning biology students (in high school) are fairly adept at interpreting basic information from graphs, though scatter plots are sometimes challenging for them. I usually do this type…
-

Claim, Evidence, Reasoning (CER) Science Topics
A list of topics and articles for students to use to practice claim, evidence, and reasoning.
-
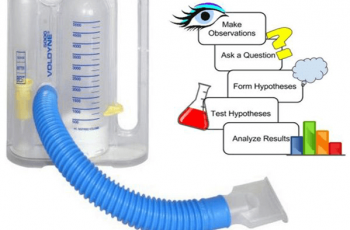
Investigation: Processes of Science
Students must develop their own causal question about what biological factors affect a person’s lung capacity, Then test their hypothesis using a respirometer.
-
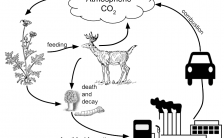
Analyzing Graphics: The Carbon Cycle
This graphic illustrates how atmospheric carbon dioxide is produced during cellular respiration and combustion and then taken up by plants. Students apply what they have learned about the processes of photosynthesis and respiration to label parts of the graphic an answer questions. This activity is probably best done as a pair-share activity or a…
-
How to Use a Spreadsheet to Create a Graph
High school teachers often assume that their students know how to use basic word processing programs, internet browsers, and spreadsheets. My students come to me with very little knowledge in how to do advanced tasks in those platforms, like inserting a graph or image. I created this assignment to give students an introduction into…
-
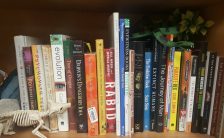
Maintaining a Science Library
My classroom has a collection of science themed books that are not textbooks that I periodically share with my students. For example, when discussing biochemistry at the beginning of the year, you will find a copy of the Poisoner’s Handbook on my desk, with several post-it notes attached. Students are curious about the…