
Search results for: “teacher”
-
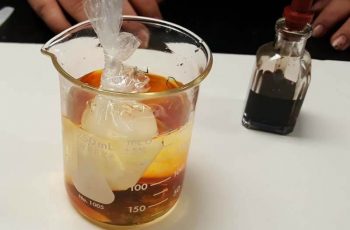
Investigation: How Can Diffusion Be Observed?
This investigation provides a hands-on way to observe what happens when a chemical moves across a semipermeable membrane. In this case, a cheap plastic bag serves as a model for the cell membrane and shows that iodine will move into the bag and turn the contents purple.
-
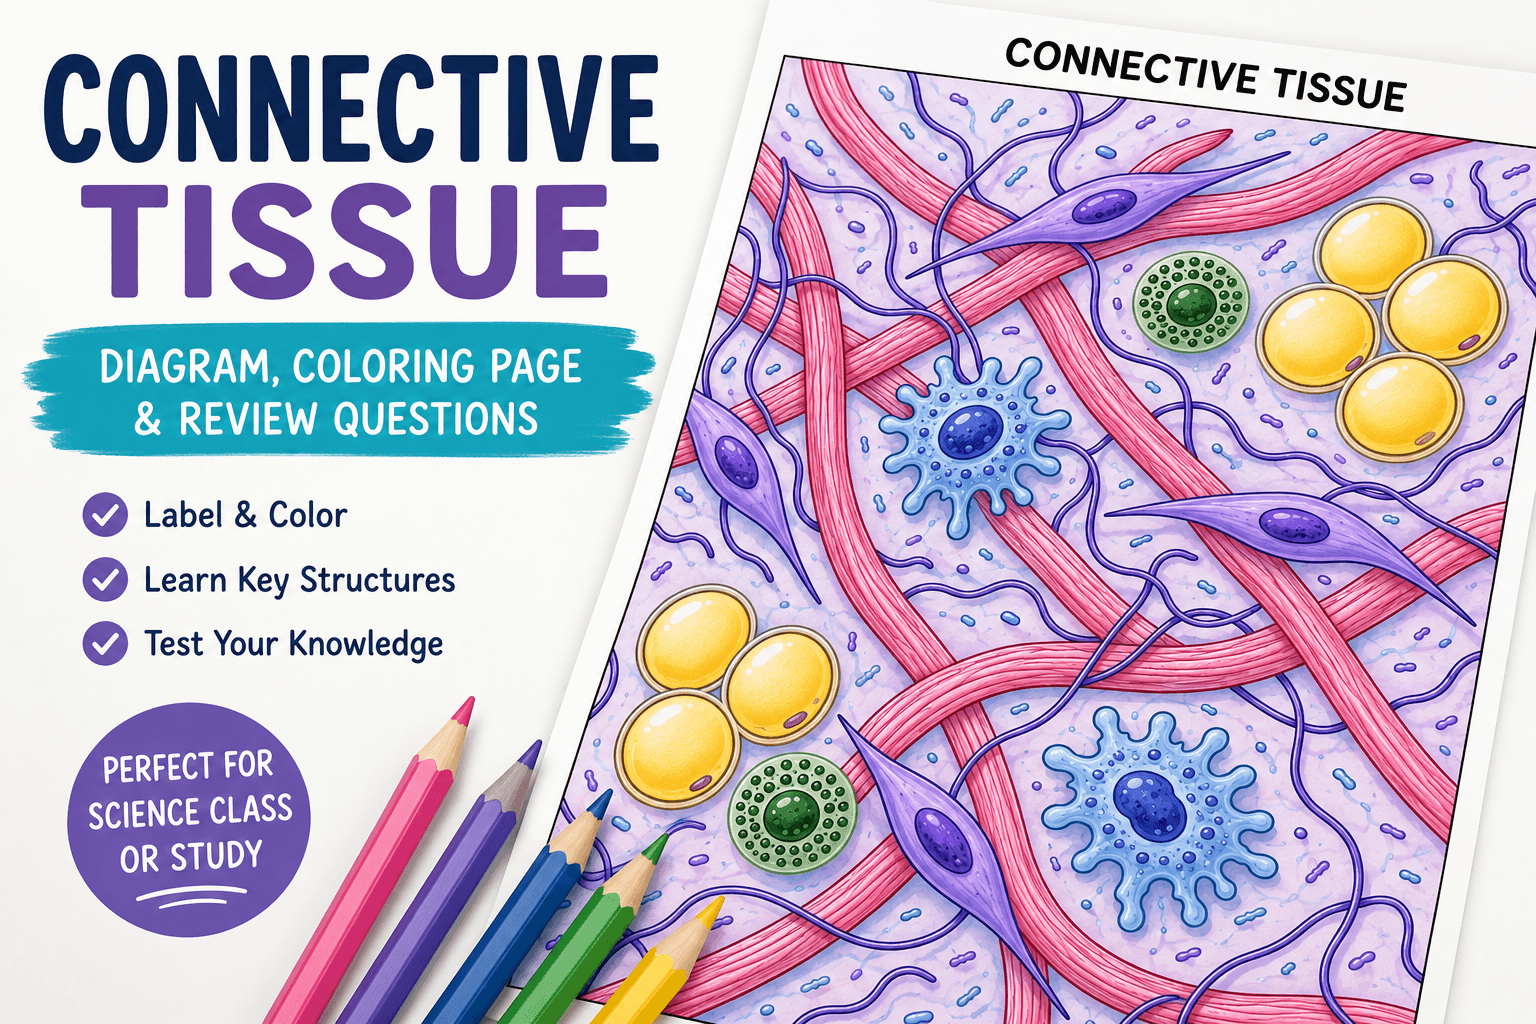
Color the Connective Tissue Matrix
This worksheet was designed for anatomy and physiology students to compliment a lesson on the body tissues. This coloring exercise is not intended to take very long and is mostly to help students gain an appreciation for the complexity of the matrix. The entire unit, which includes google slides and other resources can be seen…
-
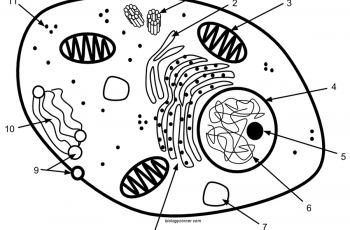
Cell Labeling: Simple and Complex
Students practice labeling organelles on a simple model (2D) and a more complex model. The idea is for students to gain an appreciation for how cell diagrams are created. They don’t all look alike, and are often artistically created. Cell organelles tend to follow basic design rules, like the mitochondria will generally look like a…
-
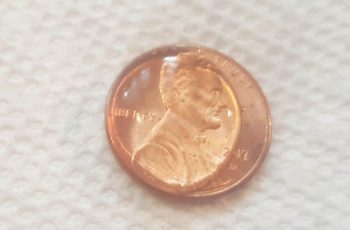
Penny Lab: Soap and Surface Tension
Most science classes begin the year with an exercise on the scientific method. It can be difficult to plan a short activity that will reinforce the main ideas of developing and testing a hypothesis. This lab is simple and doesn’t require much in the way of materials: pennies, water, and pipettes (and paper towels for…
-
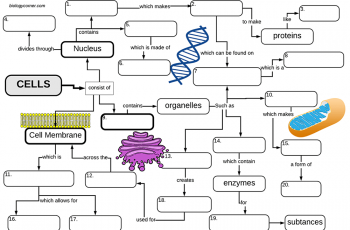
Cell Structures: A Graphic Organizer
This graphic organizer (concept map) organizes the cell structures around three main parts of the eukaryotic cell: the nucleus, cytoplasm, and cell membrane.
-
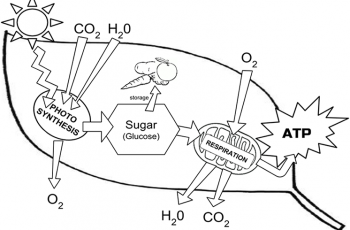
Photosynthesis Coloring
Students read short text passages and then color images to help them relate the textual information with the graphic.
-
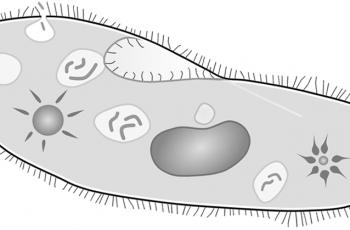
Comparing the Ameba to the Paramecium
With the adoption of NGSS, I’ve had to make cuts to some of the lessons that biology classes of the past enjoyed. I was sad to see it go, but we no longer do a unit on the Kingdom Protista, but I still manage to fit a microscope lab into other sections.
-
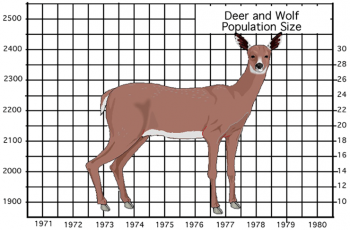
Deer: Predation or Starvation?
This activity asks students to calculate the population change (births – deaths) and then graph the number of deer and the number of wolves.
-
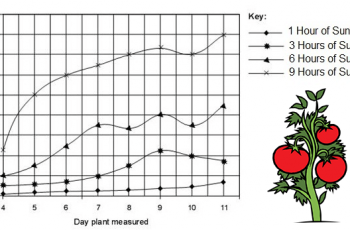
Data Analysis and Interpreting Graphs
Students practice analyzing pie charts, scatter plots, and bar graphs in the basic worksheet that is designed to pair with lessons on the scientific method. Most beginning biology students (in high school) are fairly adept at interpreting basic information from graphs, though scatter plots are sometimes challenging for them. I usually do this type…