
Search results for: “science graph”
-
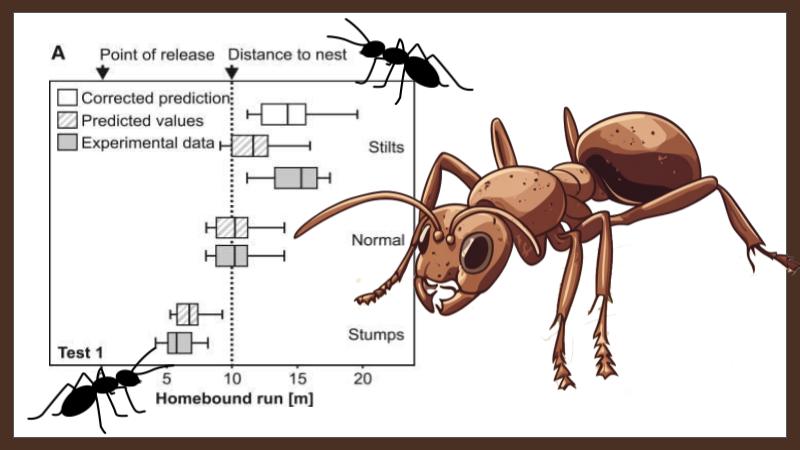
The Ant Odometer – Data Analysis
Have you ever thought about how ants navigate the world? Some ants use pheromones or other chemicals to follow trails. Other ants have a novel way of finding their way home; they count steps!How do these little biological Fitbits do this? How did scientists confirm that the ants counted steps? In this research study, scientists…
-
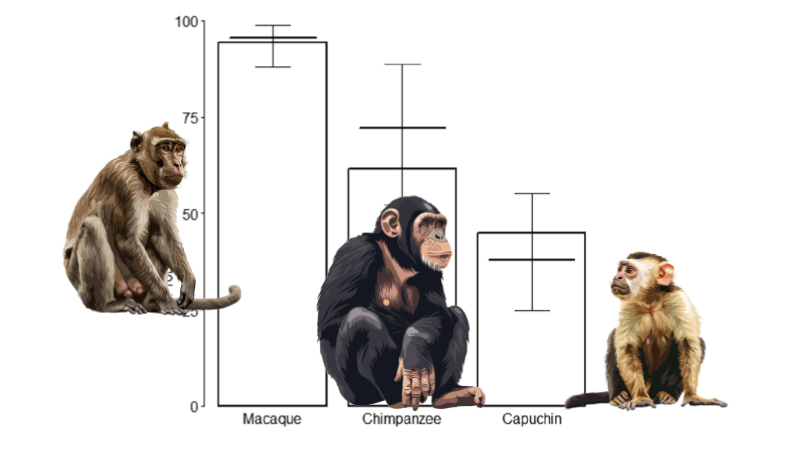
Data Analysis – Tool Use in Primates (CER)
Chimpanzees, capuchins, and long-tailed macaques use tools to crack the shells of nuts. They place the nut on a hard surface, like a flat rock, and strike it with a stone to crack the shell. These three primate species use different techniques. Chimpanzees and macaques crack the nuts while sitting, but the capuchin stands on…
-
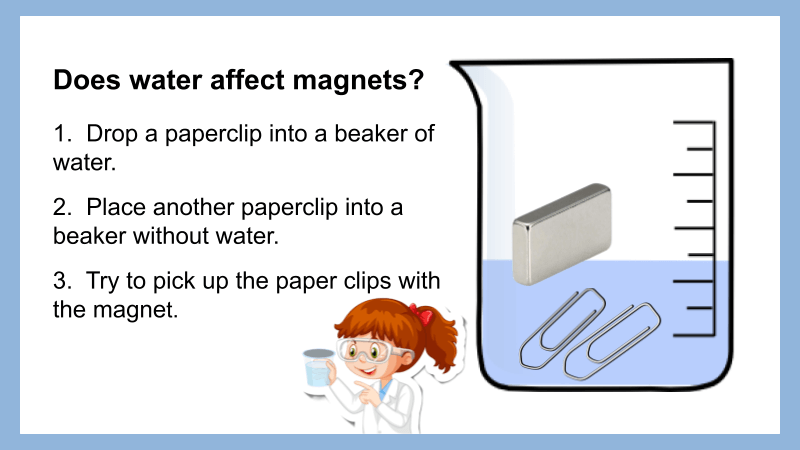
Identifying Variables – Lab Station Activity
Students explore the scientific method by completing lab station activities where they identify the dependent and independent variables.
-
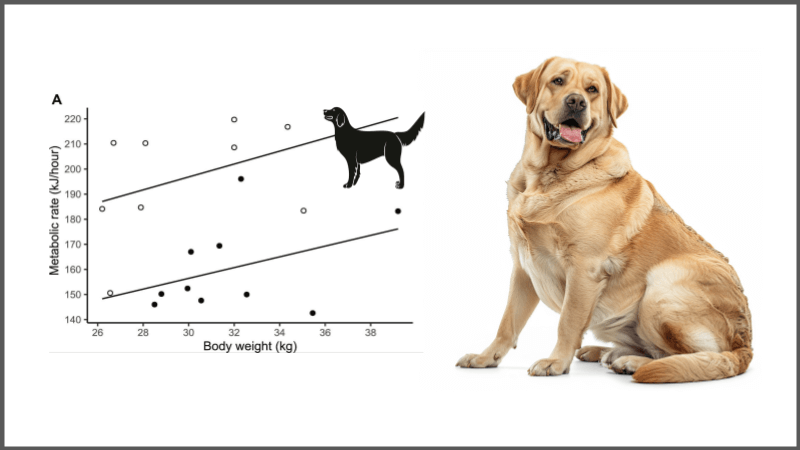
Dog Obesity and Analyzing Scientific Texts
Introduce students to scientific texts by examining research on dog obesity and a possible genetic cause. Dogs with mutations have increased food motivation and body fat.
-

Case Study – Effects of Coyote Removal in Texas
Examine data from an experiment where coyotes were removed from test sites. Evaluate the effects on rodents and mesopredators.
-
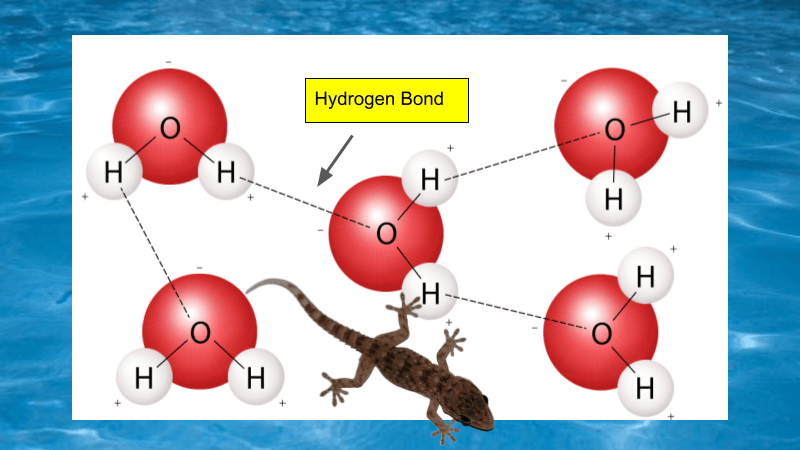
Reinforcement: The Chemistry of Life
A reinforcement worksheet on the chemistry of life. Practice vocabulary on atoms, molecules, macromolecules, and properties of water.
-
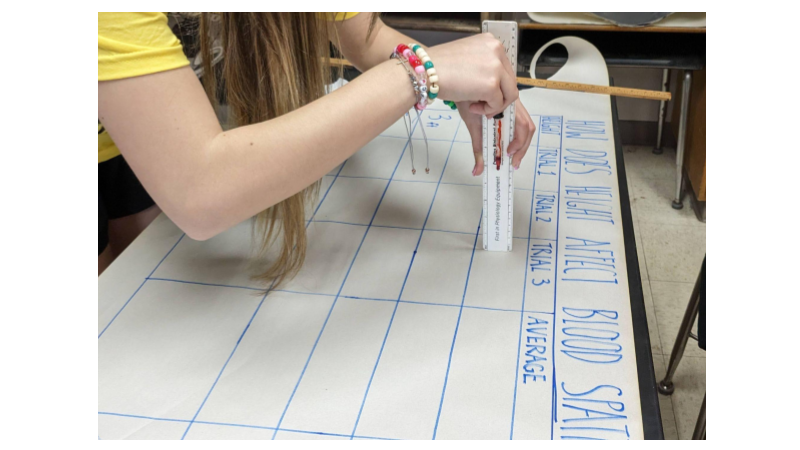
Forensics Lab on Blood Spatter
Explore forensics with this lab on blood stain analysis. Use fake blood to determine how height affects the diameter of the stain
-
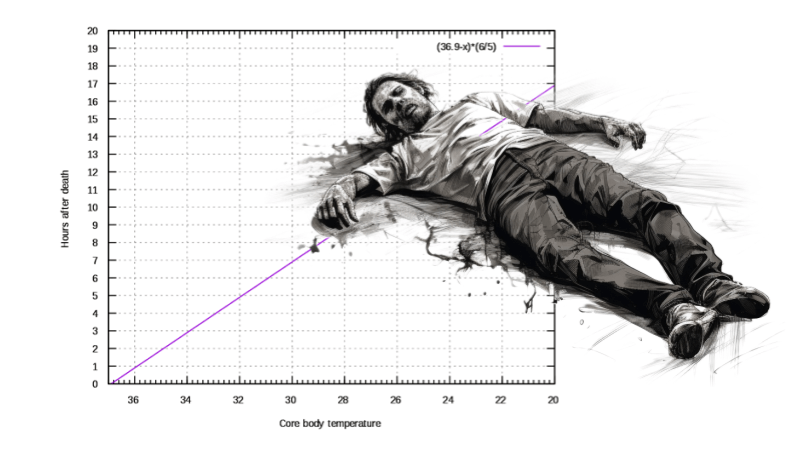
Forensic Activity – Calculating Time of Death
Student activity on forensics where time of death is calculated with an equation or graph.
-
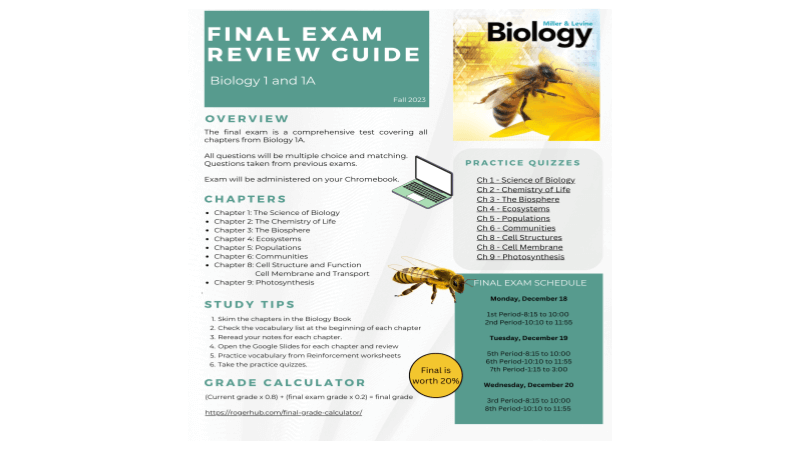
Biology 1 Final Exam Review Guide (Bee Book)
Study for your biology final exam with these comprehensive resources! Access study guides, practice tests, and key materials to ace your test!
-
Scary Pumpkin Statistics
Students predict the number of seeds in a pumpkin and then count the seeds. They use chi square analysis to accept or reject the null hypothesis.
-
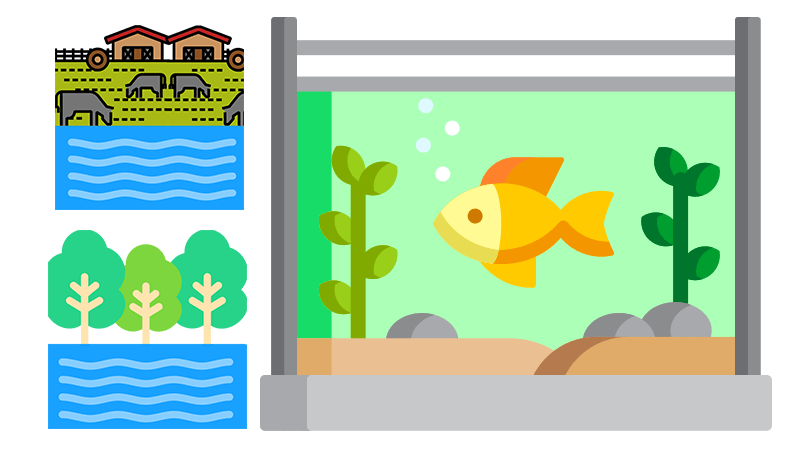
What Causes Algae Growth in Ponds?
Students examine data on two ponds to determine what is causing the algae growth in the pond near a farm.
-
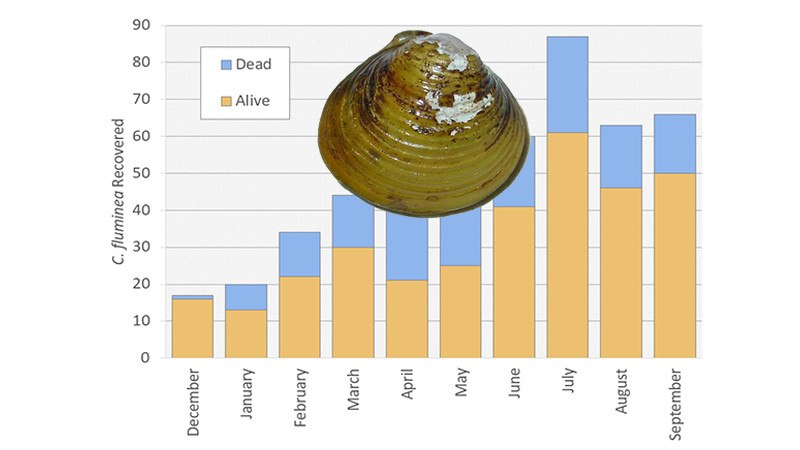
A Clammy Problem – Invasive Mollusks in Michigan
Examine a graph showing the numbers of invasive clams collected in a lake in Michigan. Answer basic questions about data and write a CER.
-
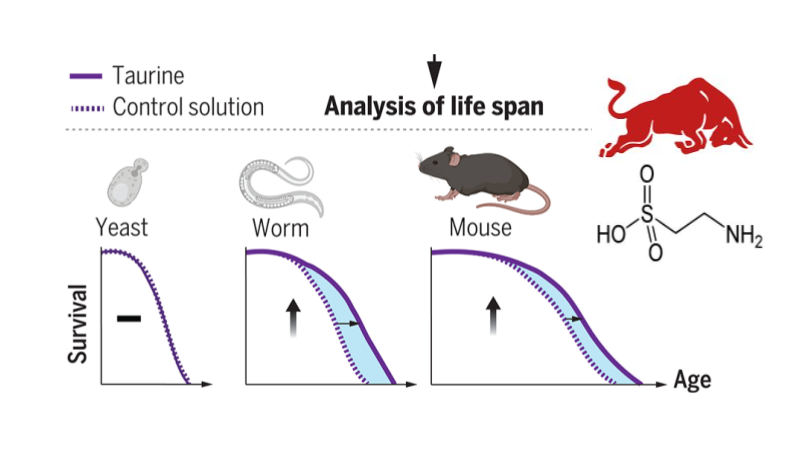
Interpreting Diagrams – Taurine and Aging (CER)
Students analyze a graph showing the effects of the amino acid taurine on aging. The data is from a primary source. Identify claim, evidence and reasoning.
-
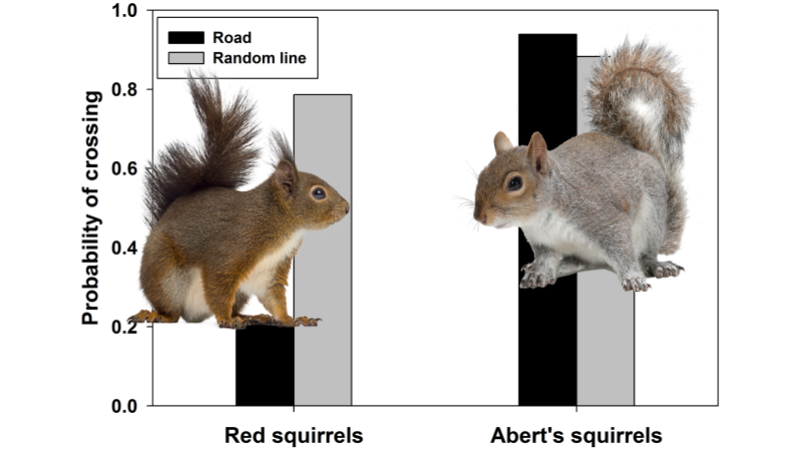
Effects of Roads on Squirrels and Space Use
A data analysis on squirrel behavior based on a journal article. Explores the behavior of two types of squirrels in response to roads.
-

Biology 1 Curriculum with Course Map and Materials
Our school adopted the Miller and Levine Bee book this year (2023) and much of my older resources needed updating. The sequence is slightly different than the old textbook. Students learn ecology in the first semester instead of the second. You can access the complete curriculum for the 1st semester at Biology 1 & 1A…