
Category: Ecology
-

Analyze Data and Create a Climate Graph
Students practice analyzing climate graphs of four regions in the United States. Answer simple questions and create a graph from data collected in Germany.
-

Biology (Bee Book) Units 1 & 2 Reading Guides
Unit 1 and 2 Reading Guides for Miller and Levine Biology (Bee Book). Google Doc versions that can be shared on learning platforms.
-

Investigating Sea Turtles and Sex Determination
Create a model of a turtle nest to record temperatures at different depths. The temperature of the nest will determine whether turtles are male or female.
-
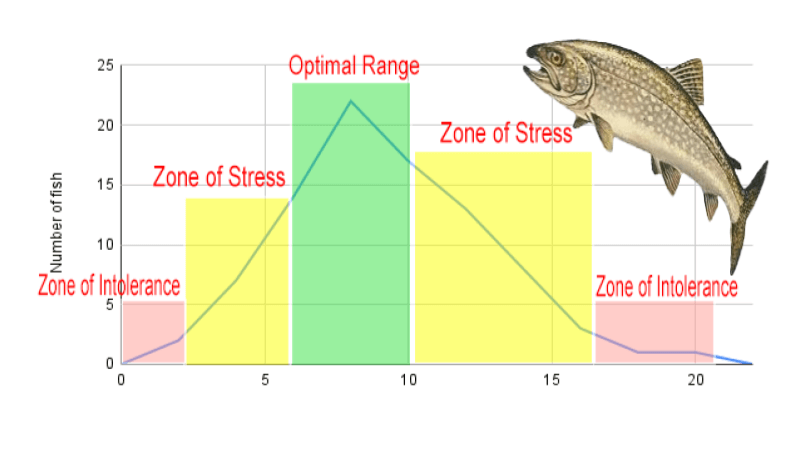
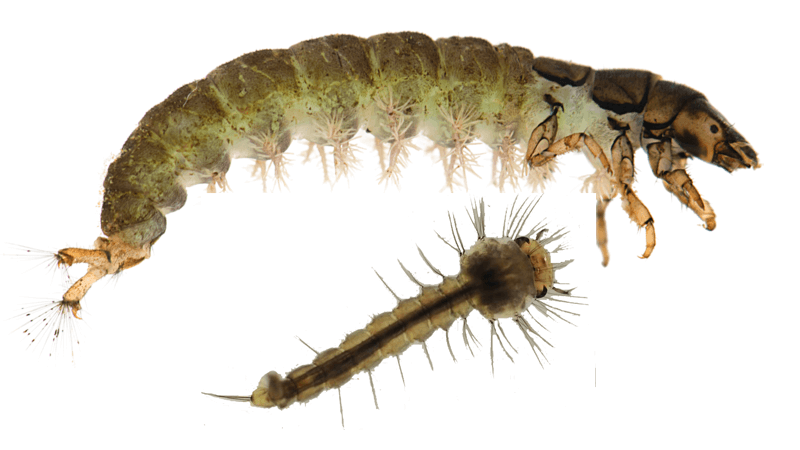
Exploring Range of Tolerance in Steelhead Trout
Students learn about the range of tolerance by graphing the number of trout found at different temperatures in a stream. Includes analysis questions.
-
Explore Limiting Factors and Carrying Capacity
Explore how limiting factors affect population growth. Students learn the definition of a limiting factor and apply it to several scenarios.
-
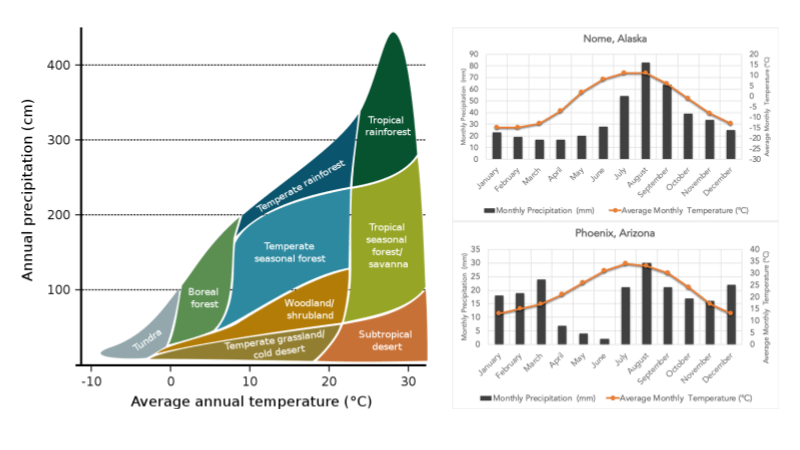
Analyzing Data – Explore Features of Biomes
Practice analyzing data from graphs in this exercise. There are several graphs that show precipitation and temperature of nine major biomes of the world.
-
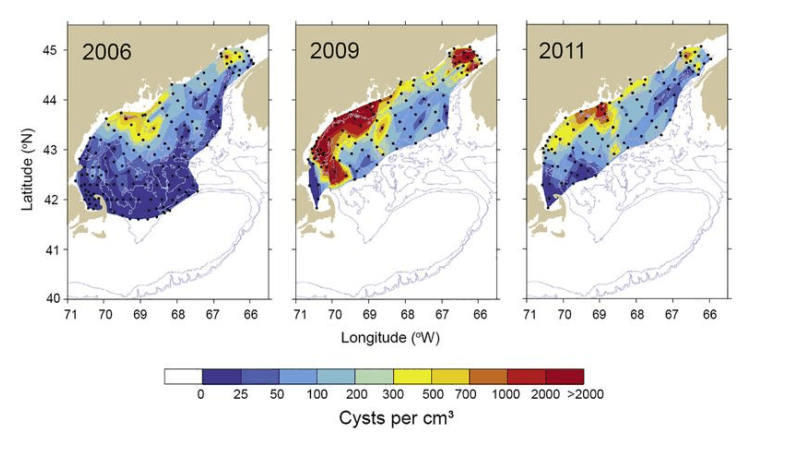
Investigating Algae Blooms and Dinoflagellates
Explore data on algae blooms by creating a heat map revealing changes in algae over time. Discuss the role that humans have on algae growth.
-
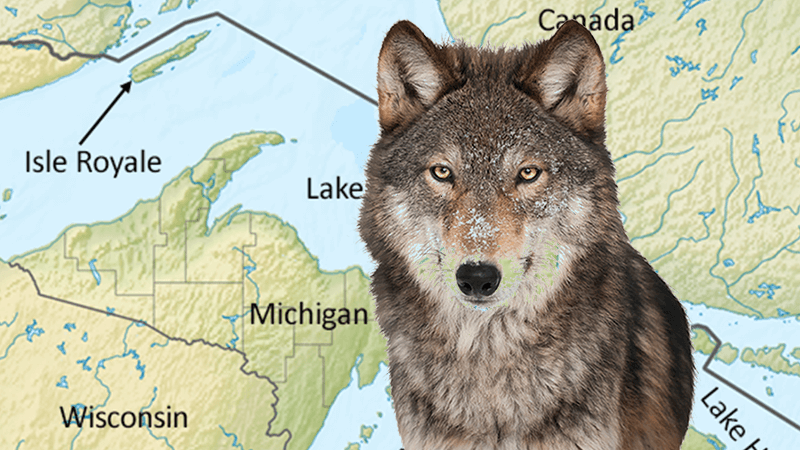
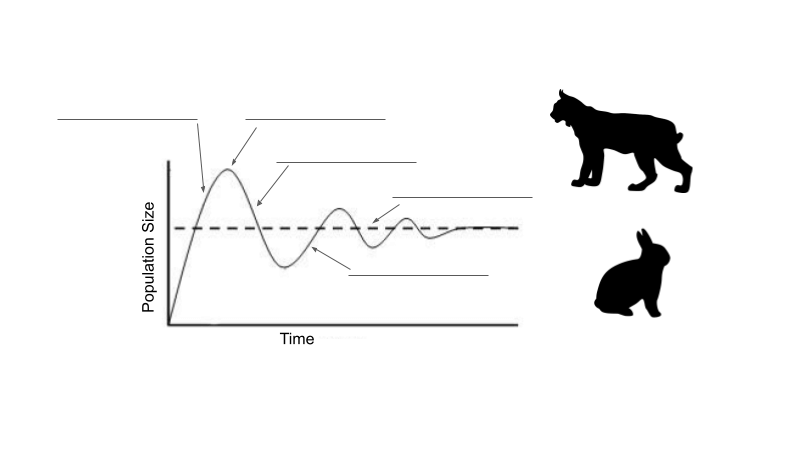
Ecology Case Study – The Wolves of Isle Royale
Case study explores the interactions of wolves and moose on Isle Royale. Students examine data on population growth and spinal deformities caused by inbreeding.
-
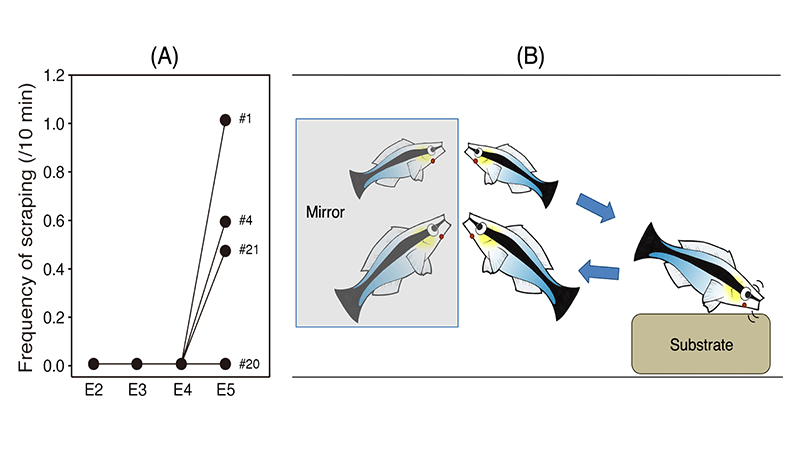
Can Fish Recognize Themselves in a Mirror (CER)
Examine data that supports the claim that fish exhibit self awareness. Fish scrape their bodies on substrate when they see a mark on themselves in the mirror.
-
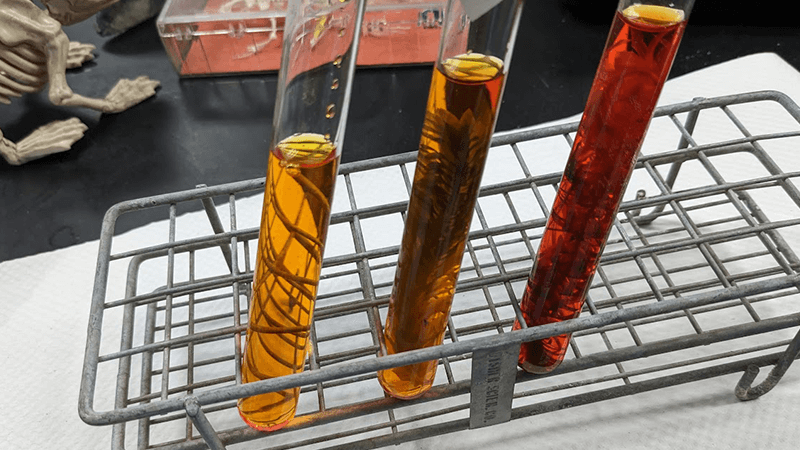
Observe Photosynthesis with this Easy Experiment
Use phenol red to observe plant photosynthesis. As plants consume carbon, the indicator will change from yellow to red. Materials are easy!
-
Macromolecules: The Building Blocks of Life
A process oriented lesson on how biomolecules are used by organisms to build tissues and maintain life. Focus is on chemistry and bonds withing molecules.
-
Case Study – How Human Activities Affect Water Quality
Use the data to determine where a river is most polluted, and determine what factors affect the composition of the water, like locations near towns or farms.
-
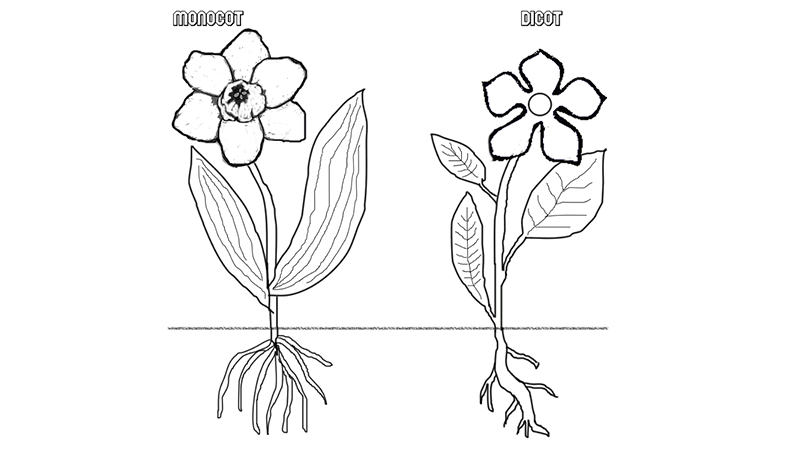
Comparing Monocots and Dicots with Coloring
Students learn about monocots and dicots by coloring diagrams of germination and flower structure. Great to pair with germination experiments!
-
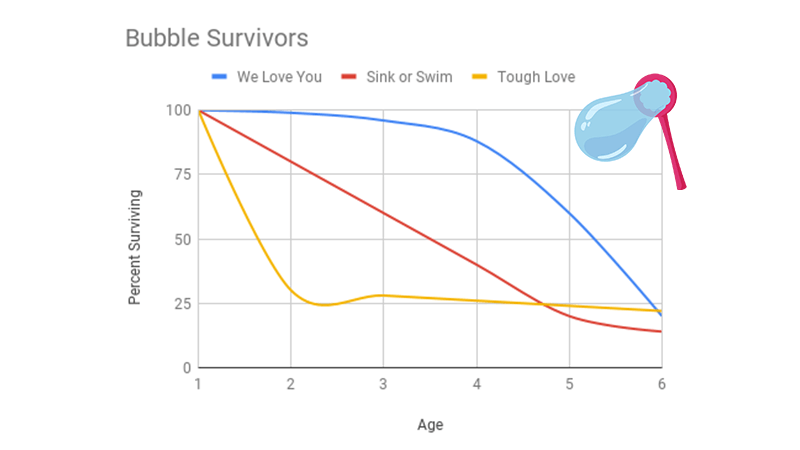
Modeling Survivorship Curves with Bubbles
A fun activity to model survivorship curves using bubbles. Students blow bubbles and time how long each survive under different conditions, then create a graph.
-
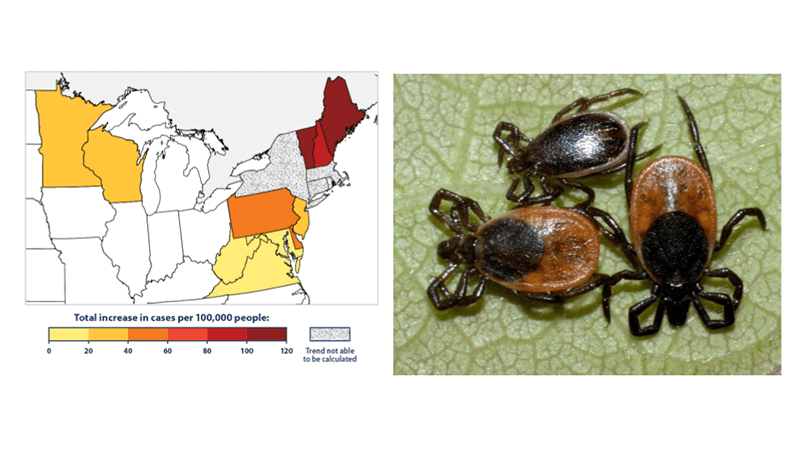
Bullseye – A Medical Case Story for Biology
A basic biology case story about ticks and Lyme disease. Learn the anatomy of a tick and how the tick transmits a bacteria that causes disease.