
A chi-square (χ2) test is a statistical test used to compare observed and expected results. It is used to determine whether a difference between two categorical variables is due to chance or a relationship between them.
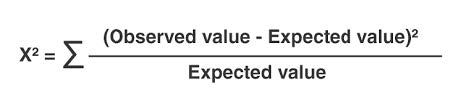
It can be used to test whether two variables are related or independent from each other, and it can also be used to test the goodness of fit between an observed distribution and a theoretical distribution of frequencies. The formula for chi-square is:
The basic idea behind the test is to compare the observed values in your data with what would be expected if the null hypothesis is true. The test involves calculating a test statistic, and the result is compared to a critical value. If the test statistic is greater than the critical value, the null hypothesis is rejected, and it is concluded that there is a significant difference between the observed and expected values.
In this activity, students count kernels on an ear of corn. The corn is the product of a dihybrid cross, so that the phenotype of the kernels will follow a 9:3:3:1 ratio. Corn can be purchased from biological supply companies or through Amazon. The activity does not require growing the corn, so it can be completed in one class period.
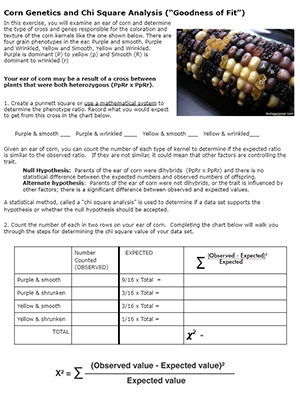
After students collect data on the kernels (yellow/purple, smooth/shrunken) they use a chi square analysis to determine if the number was close enough to support the hypothesis that the parents were heterozygous for both traits (PpSs x PpSs).
If you want a delicious activity on chi square analysis, check out Chi Square with Candy!
If you don’t have corn, you can use the remote version of this activity where students view photos of the corn.
Grade Level: 9-12 | Time Required: 45 minutes
HS-LS3-3 Apply concepts of statistics and probability to explain the variation and distribution of expressed traits in a population.