
Tag: scientific
-
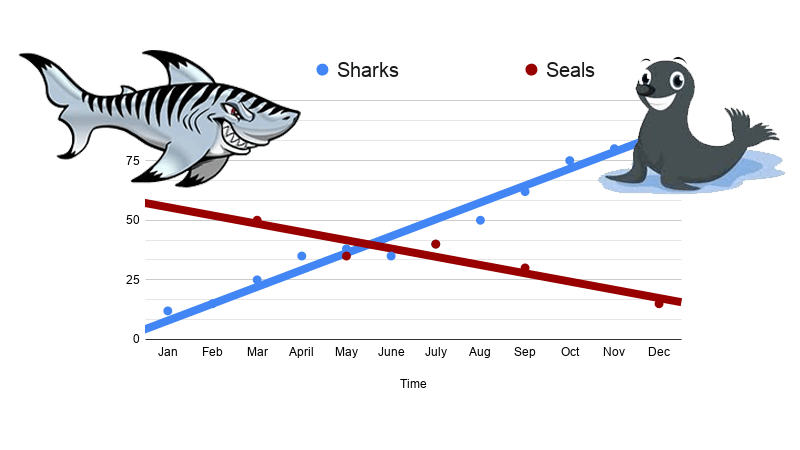
CER – Data Analysis with Sharks
Shark data by month where students make a LINE graph to show how the population changes over time. Students complete a CER to discuss results.
-
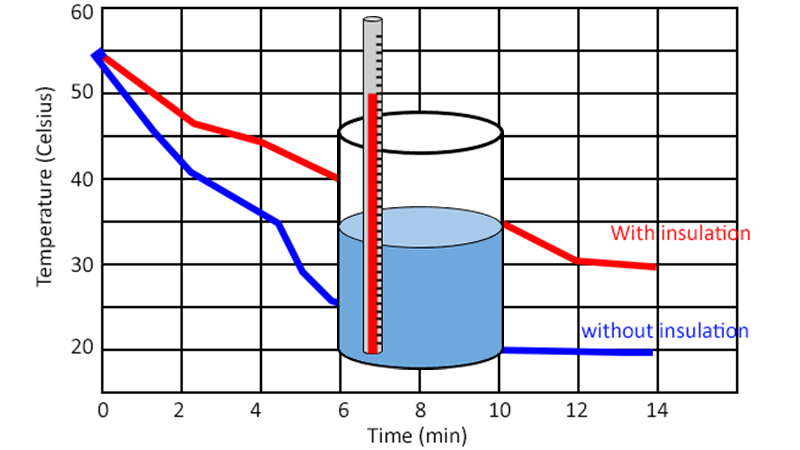
Investigation: Heat Loss and Insulation in a Jar
This simple experiment can be used as a way to introduce the scientific method. Students design an experiment to test which materials are the best insulators by measuring heat loss. The materials are simple, and the experiment doesn’t take very long. They will need two beakers per group, a thermometer, and hot water. Also, a…
-
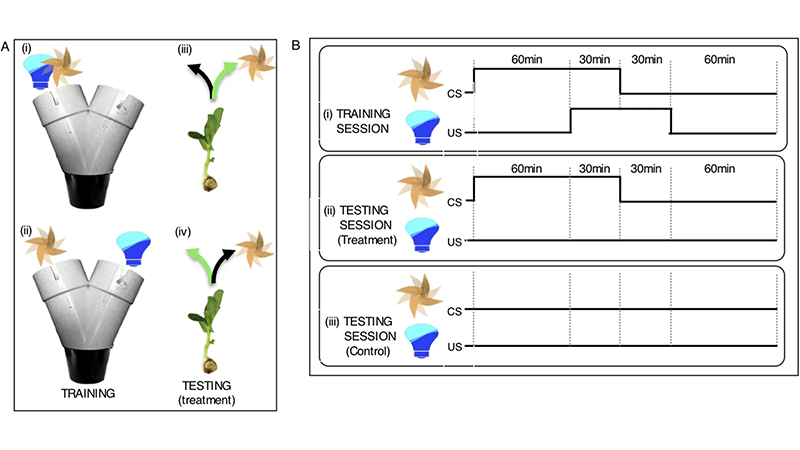
Can Plants Learn?
An experiment to determine if plants could learn by association Identify key features, such as variables, controls. Based on a real experiment in Nature.com.
-

Early Discoveries – CER
Explore historical scientific discoveries, like Pasteur’s experiments to learn about the scientific method.
-
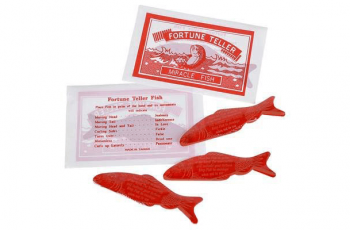
Fortune Telling Fish
This activity is perfect for a first day or as an introduction to the scientific method. Though there isn’t quite as much cooperation as the “Saving Sam” activity, the fortune telling fish allows students to explore the nature of science together. The handout linked can be given to students, or you can also project them…
-
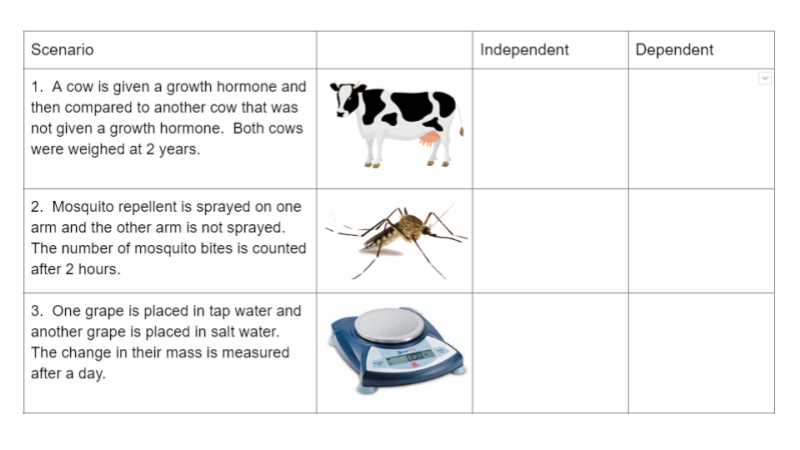
Independent & Dependent Variables Practice
Students reach short scenarios about scientific experiments. They identify the controls and variables in each story.
-
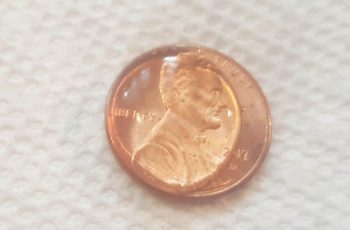
Penny Lab: Soap and Surface Tension
Most science classes begin the year with an exercise on the scientific method. It can be difficult to plan a short activity that will reinforce the main ideas of developing and testing a hypothesis. This lab is simple and doesn’t require much in the way of materials: pennies, water, and pipettes (and paper towels for…
-
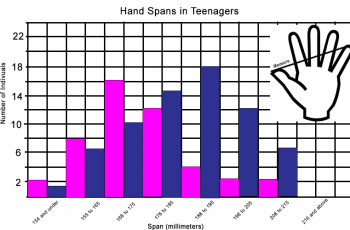
Graphing Hand Span and Height
This exercise illustrates the difference between bar graphs and scatter plots and walks students through the process of representing data they collect.
-
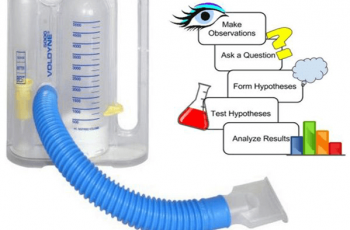
Investigation: Processes of Science
Students must develop their own causal question about what biological factors affect a person’s lung capacity, Then test their hypothesis using a respirometer.