
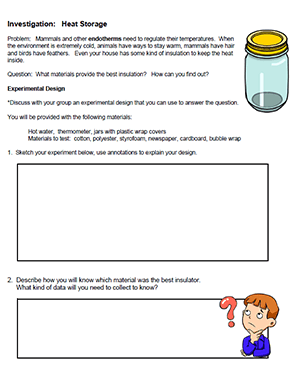
This simple experiment can be used as a way to introduce the scientific method. Students design an experiment to test which materials are the best insulators by measuring heat loss.
The materials are simple, and the experiment doesn’t take very long. They will need two beakers per group, a thermometer, and hot water. Also, a variety of insulation materials, such as cotton, newspaper, styrofoam, cardboard.
You can substitute any number of materials. You can also brainstorm with students before class about things that make good insulators. Then, bring the ones students suggest for testing.
The Experiment
First, students design the experiment and discuss what type of data they will need to gather. They will need a beaker filled with hot water. I use a kettle to heat up water in my classroom.
They will then use a thermometer to measure heat loss over 14 minutes. This is compared to another jar with a different type of insulation
Final Synthesis
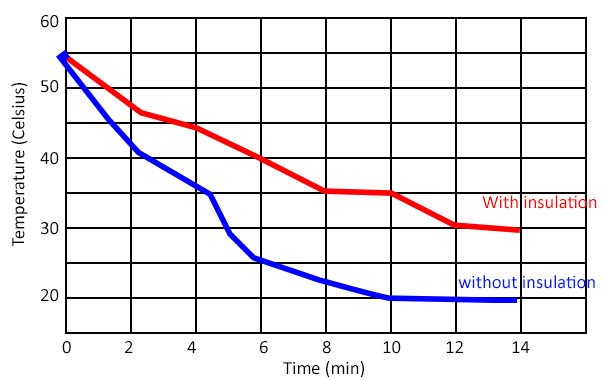
Finally, students answer questions about their experiment. They identify the control, dependent, and independent variables. Then, they create a graph that shows how temperature changes over time. Students should observe that the beaker with insulation changes more slowly than the one without insulation. Instructors can compile all the group data so they can compare different materials and determine which one is the best insulator.
The graph shown below is a example of the type of graph that students will create based on their data. You can opt to run the experiment longer than 14 minutes which may have more dramatic results. The time is based on my class period which is about 50 minutes, leaving time for discussion and completing the worksheet.
Worksheet ends with a CER (Claim, Evidence, Reasoning). Students must answer the question about which materials are the best insulators.
There are two versions of this worksheet, a regular version with mostly open-ended questions, and a simpler version that has easier questions that are multiple choice. The simple version also has the graph set up (X and Y axes labeled). These versions are created for differentiation in classes that may have ELL students or students with special needs.