
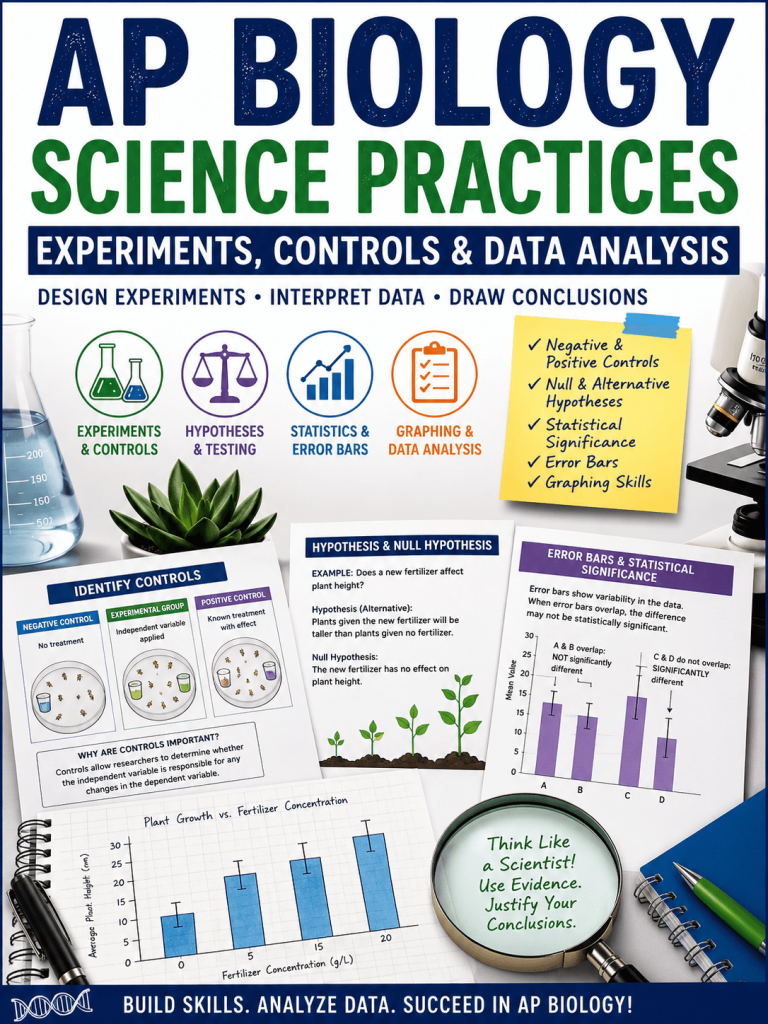
Success in AP Biology requires much more than memorizing biological concepts. The AP Biology exam emphasizes scientific thinking, the ability to design experiments, interpret data, evaluate evidence, and communicate scientific conclusions. This worksheet gives students targeted practice with the quantitative reasoning and experimental design skills that appear throughout the course and on the AP exam.
Rather than focusing on one biology topic, this resource builds the foundational science practices that students will use all year, from enzyme investigations to genetics, ecology, and evolution.
Why Science Practices Matter
Many students understand biological concepts but struggle when they must analyze an experiment or interpret unfamiliar data. AP Biology questions often ask students to:
- Identify independent and dependent variables
- Explain the purpose of experimental controls
- Write hypotheses and null hypotheses
- Interpret statistical evidence
- Evaluate graphs with error bars
- Draw conclusions supported by evidence
Developing these skills early helps students feel more confident when tackling both laboratory investigations and AP-style exam questions.
Practice with Experimental Design
The first section focuses on one of the most common AP Biology skills: identifying control groups and explaining why they are included in an experiment. Students analyze investigations involving Daphnia heart rate and plant growth hormones, identifying appropriate controls and justifying their role using the independent and dependent variables rather than relying on vague explanations.
Understanding Positive and Negative Controls
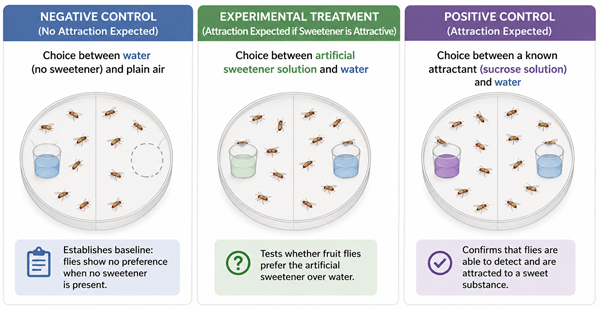
Many students confuse positive and negative controls. This resource uses clear experimental scenarios to help students distinguish between:
- Experimental groups
- Negative controls
- Positive controls
Students complete examples involving artificial sweeteners and fruit flies before applying the same reasoning to new scenarios such as antibacterial soap and hair growth treatments. By creating their own controls, students gain a much deeper understanding of experimental design.
Hypothesis vs. Null Hypothesis
Writing hypotheses is familiar to most biology students, but the null hypothesis often causes confusion.
This activity provides multiple real-world investigations where students practice writing both:
- An alternative (research) hypothesis
- A null hypothesis
Examples include fertilizer effects on plant growth, exercise and heart-rate recovery, caffeine and Daphnia heart rate, and plant hormone experiments. Students begin recognizing that AP Biology relies on statistical evidence to either reject or fail to reject the null hypothesis.
Making Sense of Statistics
Statistics can feel intimidating, but this resource introduces the concepts visually and conceptually before expecting students to perform calculations.
Students explore:
- Statistical significance
- Standard Error of the Mean (SEM)
- 95% confidence intervals
- Error bars
- Overlapping versus non-overlapping error bars
Instead of memorizing definitions, students compare data sets with identical means but different variability, helping them understand what error bars actually represent and how scientists interpret experimental results.
Learning to Read Error Bars
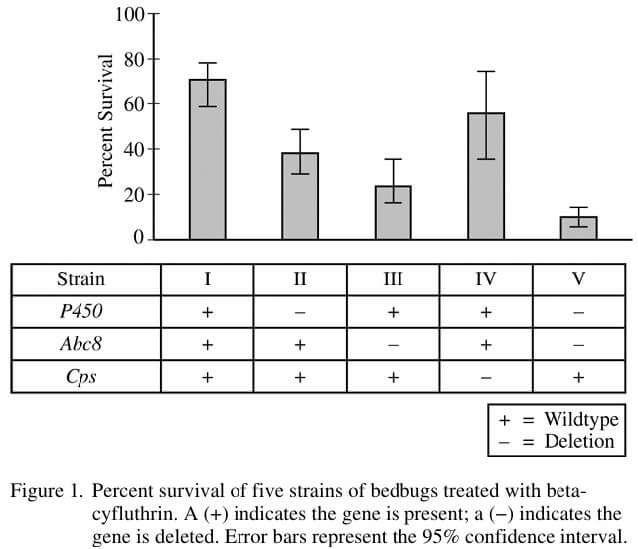
One of the most valuable sections asks students to determine whether differences between groups are statistically significant by examining overlapping error bars.
Students analyze authentic biological data and answer questions such as:
- Which groups differ significantly?
- Which data set has the greatest variability?
- How can you justify your conclusion?
These exercises reinforce an important AP Biology skill that frequently appears in free-response and multiple-choice questions.
Graphing Like a Scientist
Graph interpretation is one of the most tested skills in AP Biology.
This resource reviews how to:
- Choose the correct graph type
- Label axes correctly
- Scale axes appropriately
- Plot data accurately
- Add error bars
- Interpret graphical trends
Students then complete guided graphing practice using authentic biological data, including bar graphs, line graphs, and scatterplots with statistical information.
Related Resources
Exploration Roach – Icebreaker or first day activity to observe a living animal, brainstorm observations and sketch; create a driving question board
Ant Odometer Data Analysis – review real data that attempts to answer a question about how ants find their way home
Falling Cats (CER) – real data that explores how cats survive falls
Investigation: Oreo Cookie Lab with Stats – measure the amount of filling in regular and double-stuff Oreos; statistical analysis