
Search results for: “science graph”
-
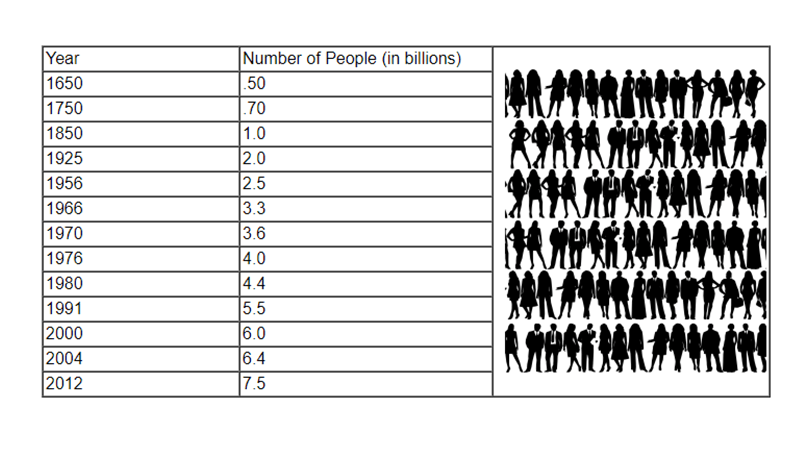
Human Population Growth
Students graph population estimates for years ranging from 1650 to 2012. The graph will show an exponential growth curve which students analyze to determine how frequently the population doubles. Students also explore the concepts of carrying capacity and growth rates. Questions ask students to discuss what happens when the earth exceeds its carrying capacity and…
-
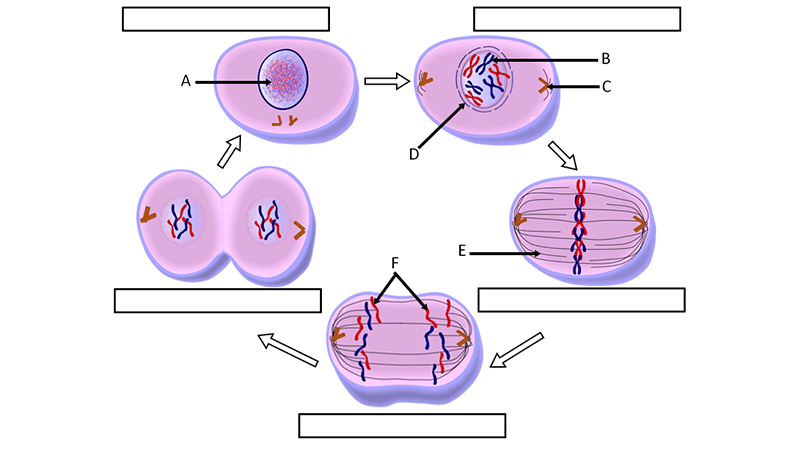
Cell Cycle Label
This worksheet was created for freshman level biology and is a simpler version of a worksheet I use in the advanced classes showing the cell cycle. The image shows a cell in interphase, prophase, metaphase, anaphase, and telophase. Students label each phase and then identify structures within the cell that are important for cell division,…
-
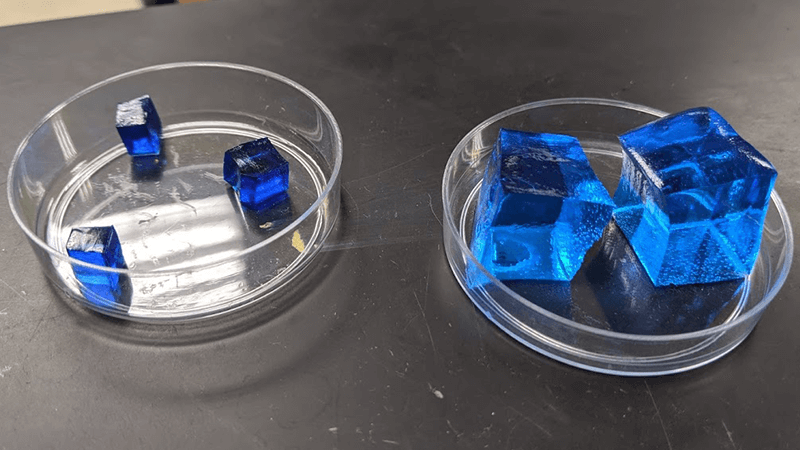
Modeling Osmosis
This basic lab uses Deco-cubes to show how they change in size when soaked in salt water, distilled water, and tap water.
-
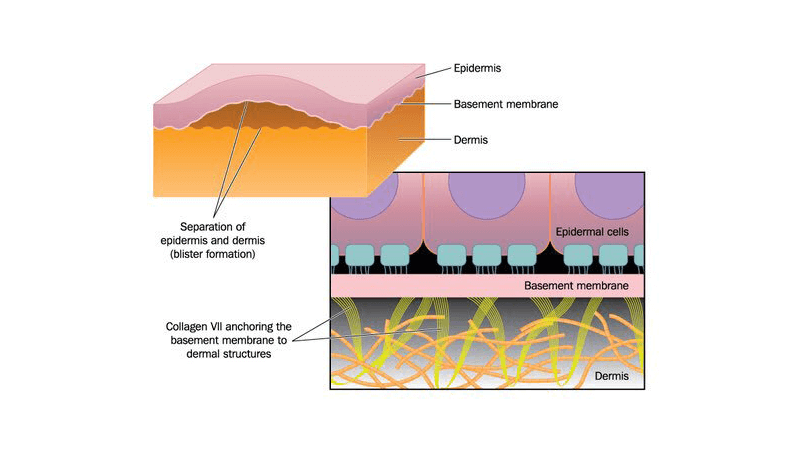
Anatomy and Physiology Lesson on Tissues
Phenomenon based unit where students examine the case of a child with the epidermolysis bullosa.
-
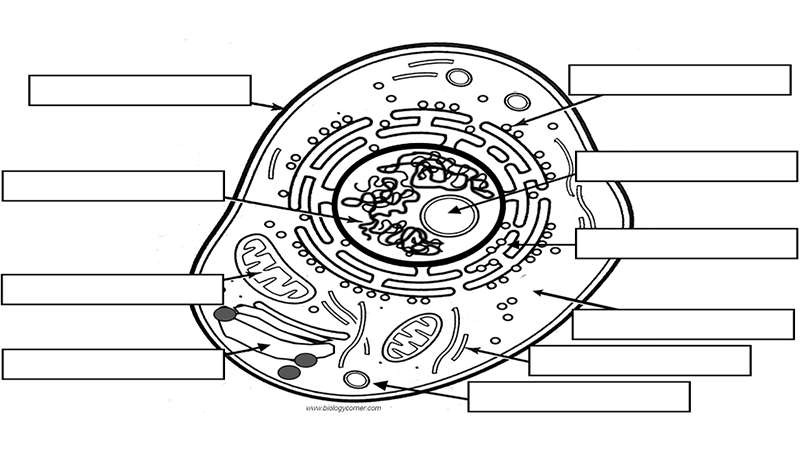
Reinforcement: Cell
This is a practice worksheet for students who are learning structures found in the cell. A list of terms can be matched with descriptions and definitions. The same terms can be used to label a diagram of an animal cell. I use reinforcement worksheets for review or remediation. I will give students 10 minutes to…
-
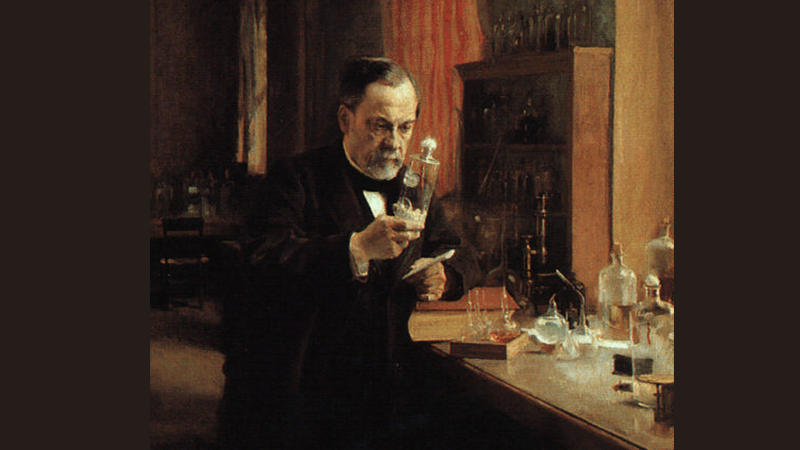
Early Discoveries – CER
Explore historical scientific discoveries, like Pasteur’s experiments to learn about the scientific method.
-
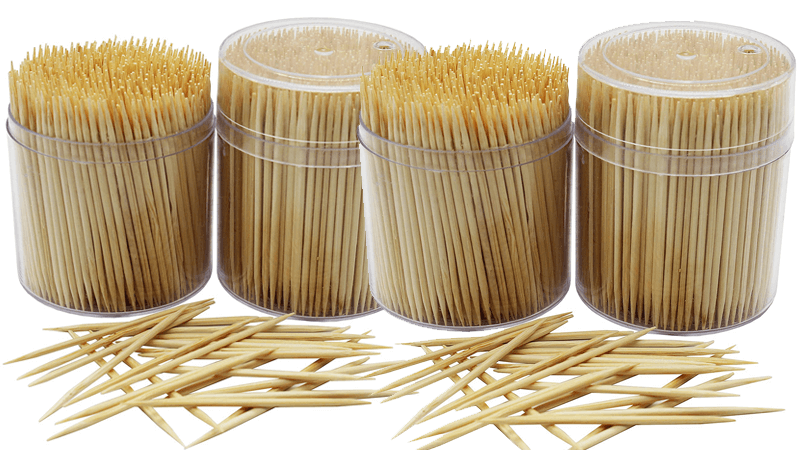
Investigation: Model Enzyme Activity with Toothpicks
Use toothpicks to model enzymes. Explore substrate and enzyme concentrations by changing toothpick numbers. Model competitive inhibition by taping fingers.
-
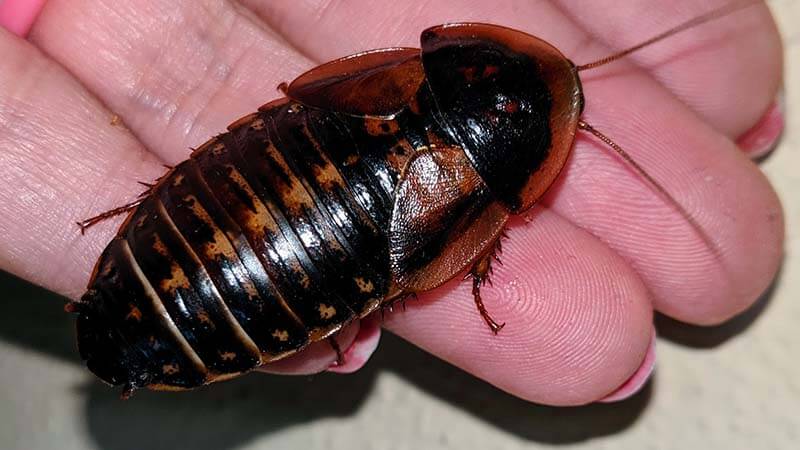
Exploration: An Inquiry Activity on the Dubia Roach
A short activity for day one in the science class. Give students a live animal to observe, like a dubia roach. They write observations, questions, and make inferences to share with the class.
-
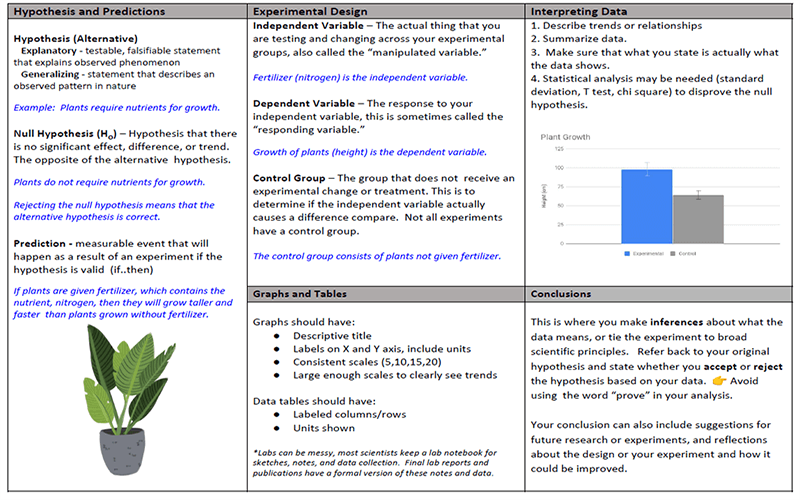
Experimental Design
Students in most science classes start with an overview of scientific processes. For advanced students, I use this cheat sheet to remind them of the major features of the scientific method, such as a control group, dependent and independent variables. AP Bio students are also introduced to the concept of the null and alternative hypotheses…
-
Laboratory Activity – Explore the Senses
Students rotate between 6 stations where they perform tasks to perform related to the senses, such as two point discrimination and reaction time.
-
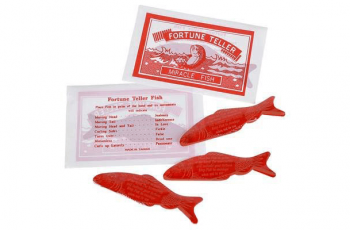
Fortune Telling Fish
This activity is perfect for a first day or as an introduction to the scientific method. Though there isn’t quite as much cooperation as the “Saving Sam” activity, the fortune telling fish allows students to explore the nature of science together. The handout linked can be given to students, or you can also project them…
-
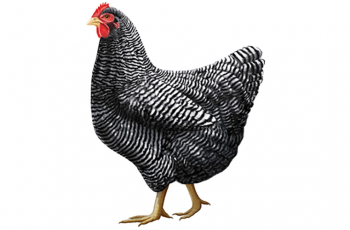
Genetics: Sexy Chickens
This worksheet was designed for advanced students of biology or for honors students who are ready for an extra challenge. Birds have a ZW sex determination system instead of the XY system seen in humans. If your students have a good grasp on sex-linked traits in humans, then this scenario is a way to really…
-
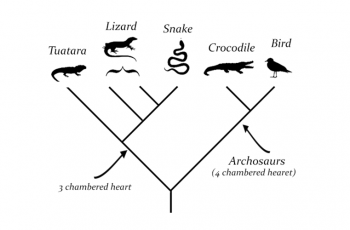
What is a Cladogram?
Students are given a description and an example of a cladogram showing the relationship between lizards, snakes, crocodiles, and birds. They are then walked through the process of creating a cladogram for five animal examples: frog, fish, bird, koala, and lizard. The process involves suggesting traits that these animals share and finding traits that are…
-
Hardy Weinberg Problemset
Hardy-Weinberg equilibrium (HWE) is a fundamental concept in population genetics that describes the theoretical relationship between allele frequencies and genotype frequencies in an ideal, non-evolving population. Students can practice using the Hardy Weinberg equilibrium equation to determine the allele frequencies in a population. This set of 10 questions gives students just enough information to solve…
-
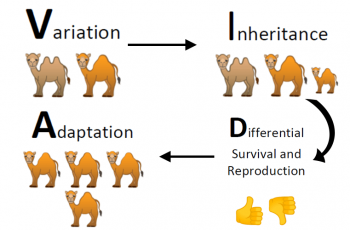
Evolution – VIDA chart
This chart is used as a graphic organizer to help students understand the process of evolution by natural selection. I use this chart multiple times throughout the unit, basically for each model organism we study. VIDA means: Variation, Inheritance, Differential Survival and Reproduction, Adaptation. These principles apply not matter what organism you are studying. For…