
The word cladogram comes from the Greek word “clados” which means branch, and “gramma” which means character. A cladogram shows hypothetical relationships between groups of organisms, or clades.
A cladogram is a diagram that shows the evolutionary relationships between different groups of organisms based on their shared characteristics. Cladograms are a method of classification based on evolutionary relationships. They show branching trees, with each branch representing a different group of organisms that share a common ancestor.
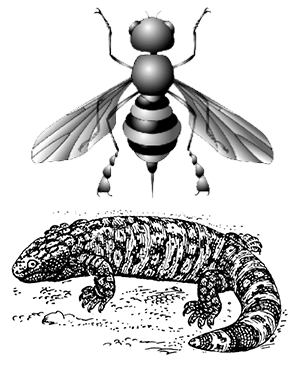
In this activity, students look at drawings of flies. They determine which individuals have which traits and complete a chart. In this activity, they look at drawings of flies to check the list for features like clubbed feet and stingers.
For a more robust activity on cladograms, students can complete a guided learning on cladograms: Constructing a Chordate Cladogram.
Once the chart has been completed, they complete a partially constructed cladogram by dragging the flies to the diagram. Google slides is a good medium for exploring the topic because students can drag images to the diagram and play with different compositions.
Heloderma Taxonomy
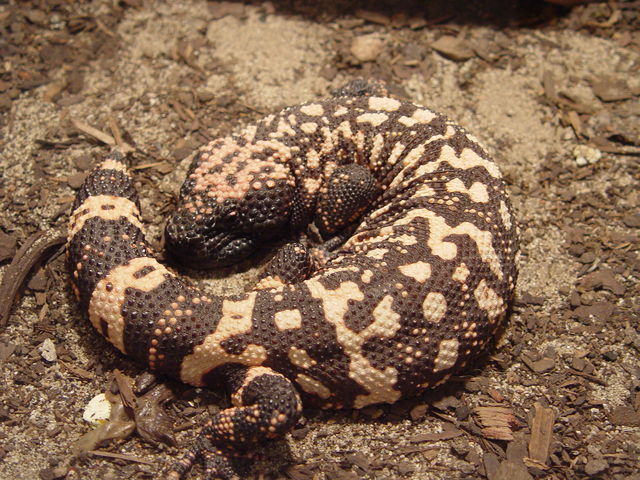
In the second section of the activity, students view photos of venomous lizards. The Heloderma genus includes 4 species of beaded lizards and the Gila monster. The photos are annotated to focus on particular traits, like dark skin and tail spots. In the final slide, students drag the traits to a cladogram.
I usually do this activity after students learn the basics of taxonomy. Students should be familiar with the naming conventions of the lizards. For example, Heloderma suspectum is the scientific name of the Gila monster. All the other members of this group have different species names, like horridum and exasperatum. It’s an added bonus that these names sound like they came out of a Harry Potter book.
Another related activity deals with the taxonomy of wolves, dogs and coyotes. Phylogenetic trees are different from cladograms in that they reveal evolutionary relationships and time scales. Microbenotes has a great page on the differences and similarities between the two diagrams.