
Hardy–Weinberg equilibrium states that the genetic makeup of a population will remain constant in the absence of other evolutionary influences. The alleles in a population will remain constant from generation to generation, unless there is mutation, gene flow, genetic drift, or natural selection.
The Hardy–Weinberg equilibrium can be used to calculate the expected frequency of alleles in a population. This information can be used to track the changes in a population over time.
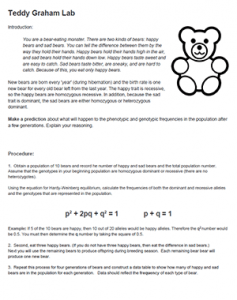
The equation for Hardy Weinberg is:
p2 + 2pq + q2 = 1
Where p is the frequency of the dominant allele and q is the frequency of the recessive allele. p2 is the frequency of homozygous dominant individuals,. 2pq is the frequency of heterozygous individuals. q2 is the frequency of homozygous recessive individuals.
Modeling Using Teddy Grahams

In this model, students use Teddy Graham crackers to explore HW Equilibrium. Their population starts with an equal number of “happy” bears and “sad bears.”
Next, students play the role of a predator that prefers the “happy” bears. After each generation, students calculate allele frequencies. They should see that the frequency of p and q change over time.
Students then create a graph that shows how the bear populations change over time. Finally, they answer analysis questions to summarize what happened during the activity.
The worksheet describes each step needed to solve the equation. I recommend students work in pairs (or small groups). This will reduce the number of packs you will need for the activity.
This activity is designed for an upper level (AP) biology class and bridges the two Big Ideas of biology: genetics and evolution. It can be a fun way to introduce HW equilibrium, but I also recommend applying the equation to real world data, like those of the rock pocket mouse.
I buy individually packaged teddy graham (snack packs) with a box of spares for students to add more bears to the population.
Grade Level: 11-12
Time Required: 20-30 minutes
HS-LS4-3 – Apply concepts of statistics and probability to support explanations that organisms with an advantageous heritable trait tend to increase in proportion to organisms lacking this trait.