Applying Hardy-Weinberg to Rock Pocket Mouse Field Data
This activity is based on a similar activity at HHMI: Color Variation Over Time in Rock Pocket Mouse Populations


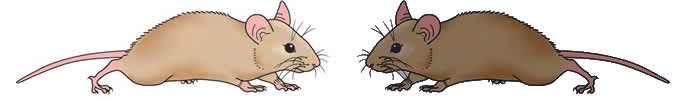
Dr. Nachman and his colleagues collected rock pocket mice across 35 kilometers of Arizona Sonoran Desert, which include both dark, rocky lava patches and light, rocky granite areas. They recorded substrate color and coat-color frequencies for six locations. The data is summarized in the table below.
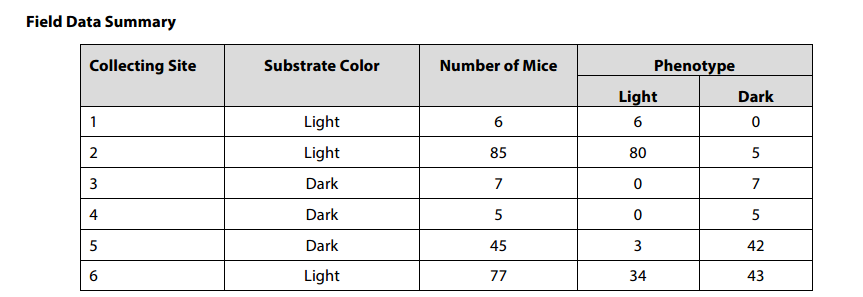
1. Calculate the frequency of light colored mice and dark colored mice found on light substrates.
Frequency = number of mice of one color / total number of mice on that substrate
Frequency of light colored mice = ______________ | Frequence of dark colored mice _______
2. Calculate the frequency of light colored mice and dark colored mice found on dark substrates.
Frequency of light colored mice = ______________ | Frequence of dark colored mice _______
3. Use the Hardy-Weinberg equation, complete the table. (Show work!)
p2 + 2pq + q2 = 1 and p + q = 1
| Light Substrate | Dark Substrate | |
| Frequency of dd (q2) |
|
|
| Frequency of DD (p2) |
|
|
| Frequency of Dd (2pq) |
|
4. Show a punnett square of two heterozygous mice crossed.
How many of the offspring are expected to be DD__________ Dd _______ dd_________
How does this percentage compare to the percentages observed using the Hardy-Weinberg equation?
5. How can the Hardy-Weinberg equation be used to show that a population is evolving?
6. Which fur color has the greatest advantage on each substrate?
7. Some people suggest that evolution is a process that occurs in other animals but not humans. Suggest a way that you could use the Hardy-Weinberg equation to show that humans also evolve?
Other Resources on Evolution
Peppered Moth Simulation – updated simulation on the peppered moth
How Did the Guppy Get His Color – guided case study exploring pools in Trinidad and guppy coloration; includes data analysis comparing pools with predators to those without
Natural Selection with Bunnies and Wolves – interactive simulation at phet.colorado.edu where students manipulate variables such as climate, fur color, presence of predator, or food limitations.
Evolution of Bunnies – examine a set of four graphics showing change over time. Great opener for evolution and introduction to VIDA charts.