
Tag: graphic
-
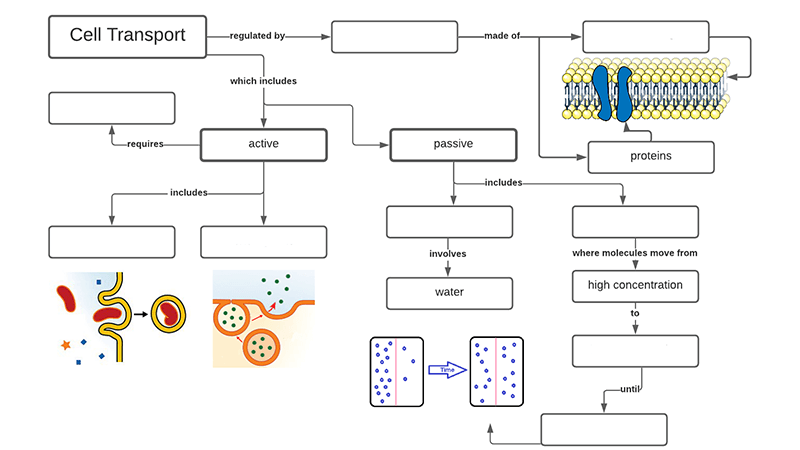
Cell Membrane Transport Graphic Organizer
Label a graphic that compares the types of transport in a cell, such as osmosis, diffusion, and active transport.
-
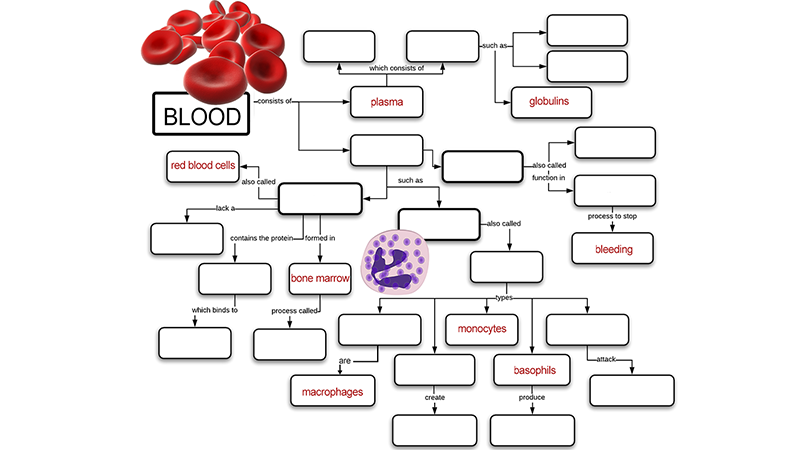
Learn about the Blood Using Graphic Organizers
Students use graphic organizers to learn about the types of blood cells and their functions. Student either complete a concept map or design their own.
-
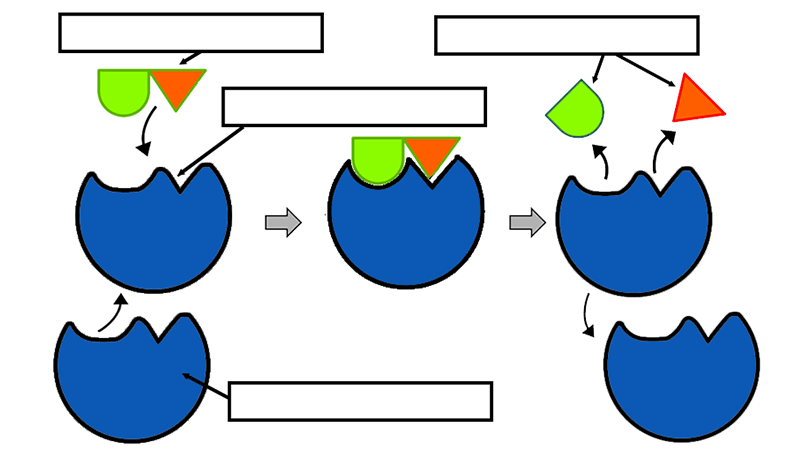
Exploring Enzymes by Analyzing Graphics
Students examine several images related to enzymes and answer questions. Worksheet covers how enzymes act on substrates, how they lower the activation energy of a reaction, how they have optimal temperature and pH, and how they can be inhibited.
-

Cellular Respiration Graphic Organizer
Students complete a graphic organizer that shows the process of cellular respiration.
-
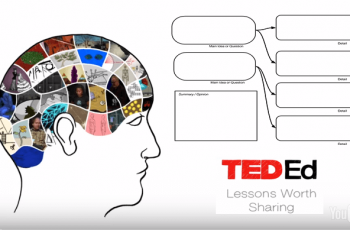
Video Lessons Graphic Organizer
This lesson introduces students to the idea of watching videos at home, taking notes, and then coming to class with understanding and knowledge to apply to a classroom activity, like a lab or discussion. Students watch a 4.5 minute TED Ed video and complete a chart on the main ideas and details.
-
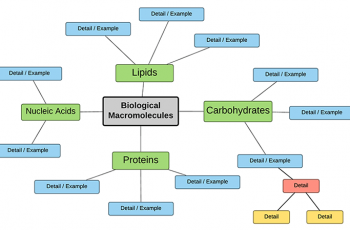
Create a Concept Map of Biomolecules
This activity asks students to work in groups to create a concept map (graphic organizer) on the biological macromolecules: carbohydrates, lipids, fats, and nucleic acids. Students are given brief instructions and a sample map to get them started, but they are responsible for determining what details are important in each section.
-
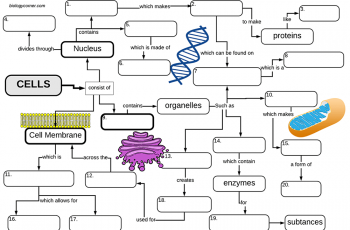
Cell Structures: A Graphic Organizer
This graphic organizer (concept map) organizes the cell structures around three main parts of the eukaryotic cell: the nucleus, cytoplasm, and cell membrane.
-
Video Lessons and Taking Notes
Many teachers have adopted a “flipped” model of instruction, where students view lectures from home and then use class time for discussions, experiments, and problem-solving. I have not fully gone to this model because many of my lectures have been redesigned as cases and include information with a discussion and a problem to solve.…
-
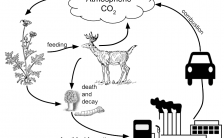
Analyzing Graphics: The Carbon Cycle
This graphic illustrates how atmospheric carbon dioxide is produced during cellular respiration and combustion and then taken up by plants. Students apply what they have learned about the processes of photosynthesis and respiration to label parts of the graphic an answer questions. This activity is probably best done as a pair-share activity or a…
-
Scientific Method – Answering Causal Questions
Examine a flow chart which considers a question about water evaporation; hypotheses are proposed to test the effects of air flow, light, and temperature.