
Search results for: “AP”
-
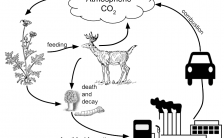
Analyzing Graphics: The Carbon Cycle
This graphic illustrates how atmospheric carbon dioxide is produced during cellular respiration and combustion and then taken up by plants. Students apply what they have learned about the processes of photosynthesis and respiration to label parts of the graphic an answer questions. This activity is probably best done as a pair-share activity or a…
-
How to Use a Spreadsheet to Create a Graph
High school teachers often assume that their students know how to use basic word processing programs, internet browsers, and spreadsheets. My students come to me with very little knowledge in how to do advanced tasks in those platforms, like inserting a graph or image. I created this assignment to give students an introduction into…
-
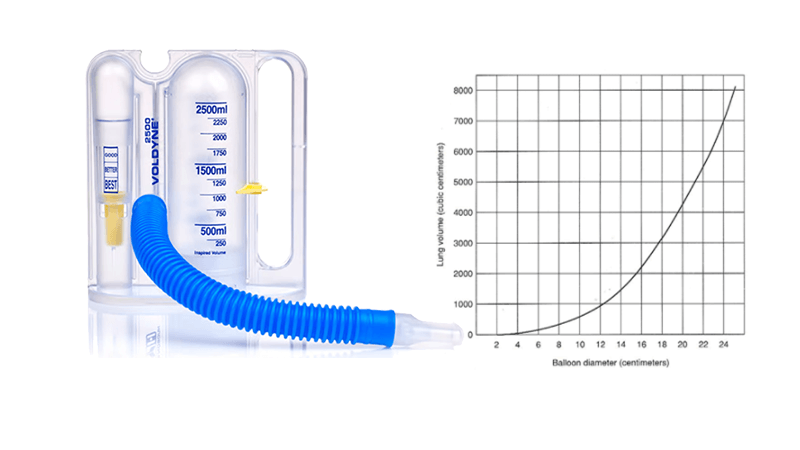
Investigation: What Factors Affect Lung Capacity
In this investigation, students use balloons and rulers to estimate the vital capacity of lungs using test subjects within the class. To perform the test, subjects take a deep breath and blow into a balloon. The diameter is measured and a graph is used to estimate the volume of air expelled based on the diameter…
-
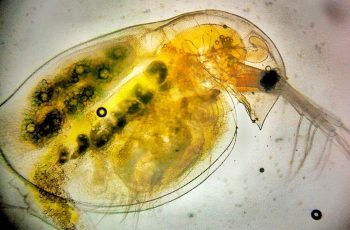
Investigation: What Factors Affect the Heart Rate of Daphnia
This investigation starts with a guided procedure where students gather data on the heart rate of daphnia when the organism is exposed to 1% ethanol. Daphnia are tiny crustaceans that are visible with the naked eye, though a microscope or stereoscope will be needed to see their heart rate.
-
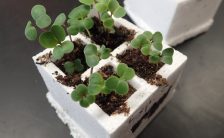
AP Biology – Investigation on Genetics with Plants
A modified AP Lab where students learn to grow plants from a seed, cross pollinate plants and conduct an inquiry investigation about plant genetics.
-
What is a Map Unit Anyway?
Chromosome maps illustrate how far alleles are on a chromosome using a MAP UNIT. Map units are based on the frequency of cross-over
-
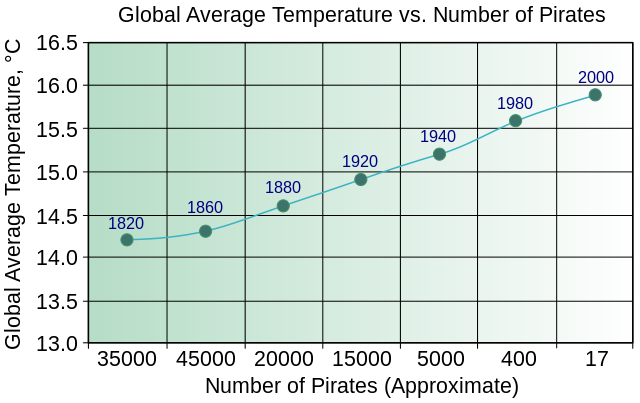
Analyzing and Interpreting data with Graphs
NGSS and AP Biology resources for interpreting data exercises in the classroom. Turn graphs into discussions and mysteries.
-
Biology Corner Site Map
-
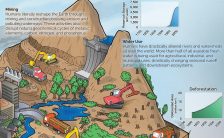
Using Infographics for Projects and Learning
Use infographics in your lessons to help students understand concepts. Students analyze graphics or create their own!
-
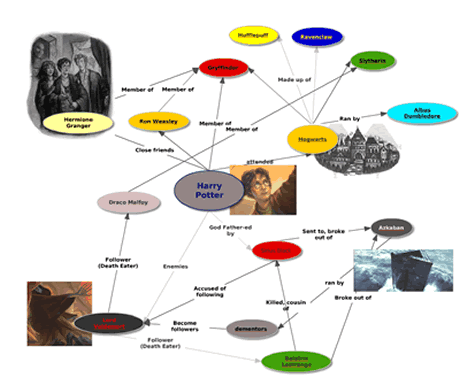
Concept Maps and Graphic Organizers
Concept mapping is a great way to get students to organize information about a topic. Sometimes I have them work in groups around poster paper, like this project in anatomy on Body Tissues. On other projects, students use concept mapping software to map topics in class, like evolution. Students can work on their own…
-
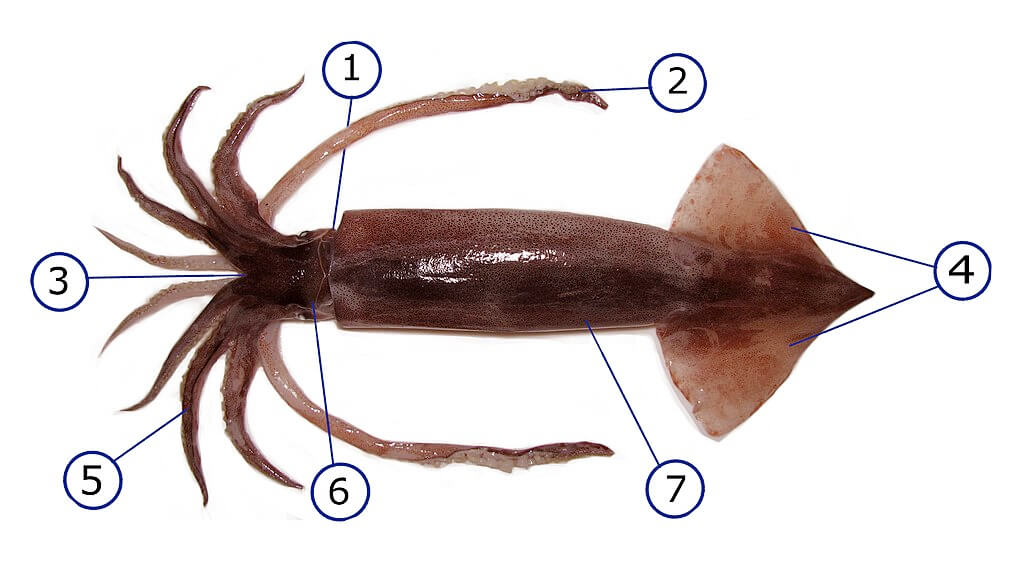
Exploring the Anatomy of a Squid
Explore internal and external anatomy of the squid with this hands-on guide perfect for educators and students, with detailed instructions and images.
-
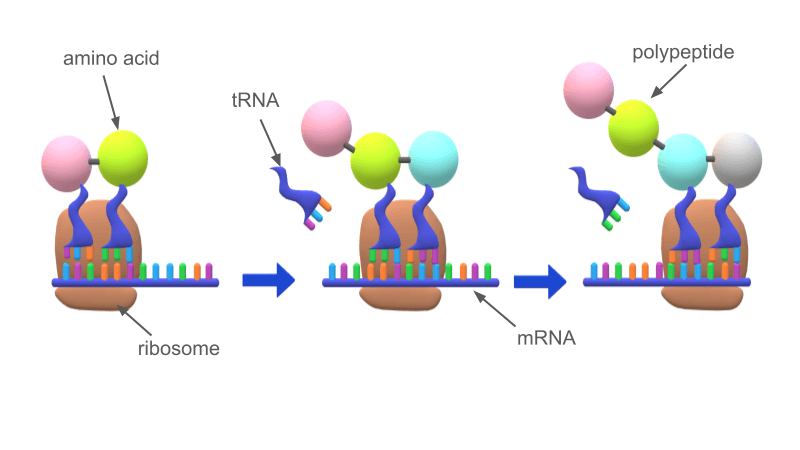
Reinforcement: RNA and Protein Synthesis
Master protein synthesis with our comprehensive practice worksheet! Practice your understanding of mRNA, rRNA, and ribosome function.
-
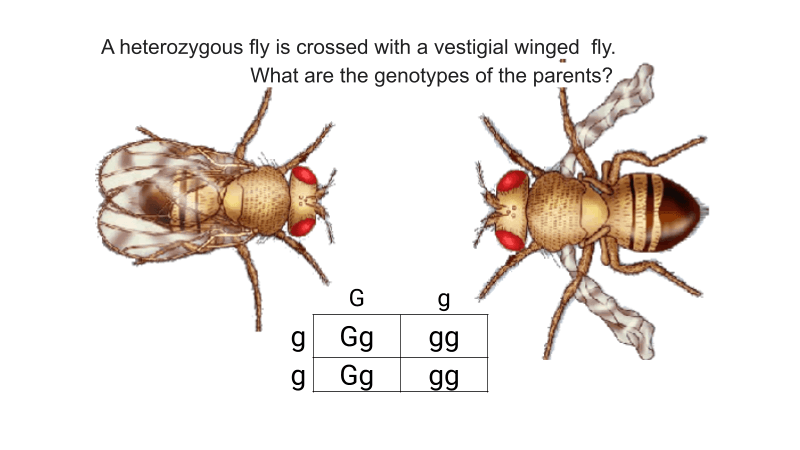
Fruit Fly Genetics
Fruit Fly Genetics showing inheritance patterns for vestigial wings and eye color.
-
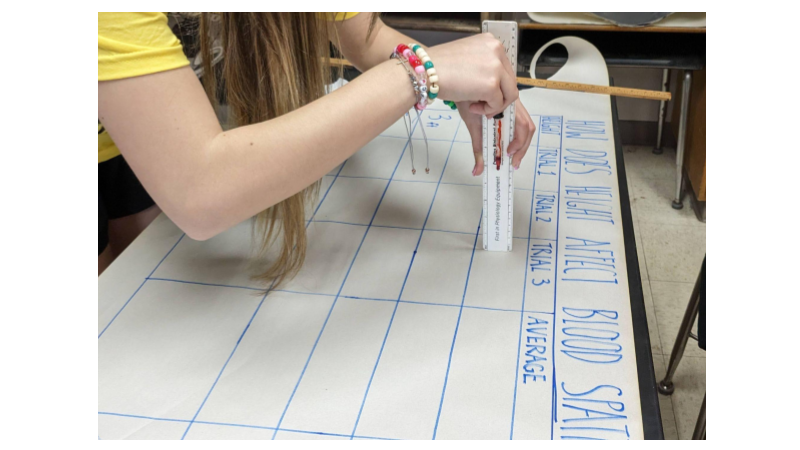
Forensics Lab on Blood Spatter
Explore forensics with this lab on blood stain analysis. Use fake blood to determine how height affects the diameter of the stain
-
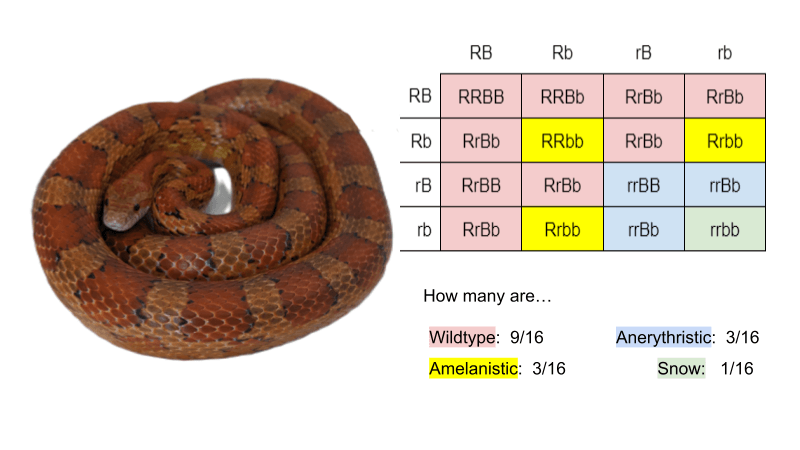
Corn Snake Genetics – Explore the Morphs!
Practice dihybrid crosses with this activity on corn snakes. Corn snakes are red and black, with variations in shade and markings.