
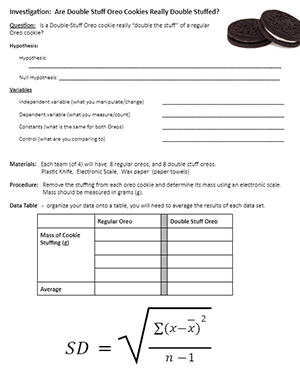
This introductory lab introduces students to the concept of hypothesis testing. Students determine if Double Stuff Oreo cookies really do contain double the amount of stuffing.
The student worksheet contains instructions and a walk-through on how to do standard deviation calculations.
You can also access the Canva version of the activity (copy to your own account, to make edits). The Canva version is the “prettier version” that I use in my own class. You can also download a PDF of this version.
This is a fun and “tasty” lab this is simple to conduct. Students have already learned how to calculate standard error using a sample set of data. Now, they simply scrape the filling out of the cookies and weigh the mass to compare the regular to double stuff. Using statistical analysis that will either accept the hypothesis (double-stuffed) and fail to reject the null hypothesis (that the filling is not twice the mass).
Then, they create a graph and add error bars to show either reject or accept their hypothesis based on the degree of overlap between the error bars. I have done this lab every year and consistently find that double stuff Oreos really do have double the amount of stuffing!
The final task is completing a Claim Evidence Reasoning chart.
Example of Reasoning:
The double stuff Oreos had double the filling. The data show that on average the Oreos that were double stuff had 26 g of filling while the regular ones had only 12 g of filling. The graph shows that if the data were doubled, the mean for the regular Oreos would be just under the mean for the double stuff Oreos, 24 g. The 2 SEM bar overlap shows that with 95% confidence, the means are similar between the double stuff and the doubled regular Oreo data set, therefore, we fail to reject the null hypothesis.