
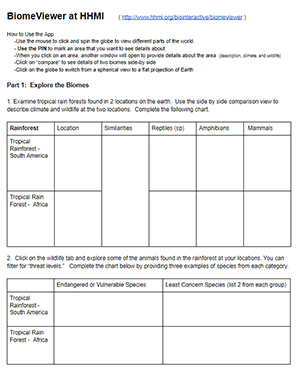
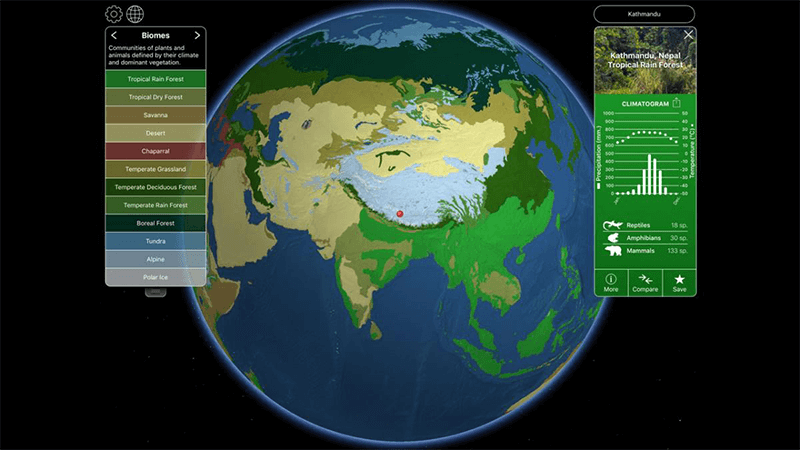
This activity asks students to explore an interactive globe at HHMI . This interactive allows students to zoom in on areas of the globe and learn details about its climate and the types of animals that liver there.
A button can be used to compare two biomes for features such as precipitation and temperature. The interactive is fun by itself and really could just be used as an overhead example during a lecture. The worksheet here was designed for individual work during Covid-19 school closures.
Students are asked to fill out a chart with information about each biome and to list the kinds animals found in each. The worksheet isn’t difficult, and I don’t have an answer key because the answer could vary quite a bit, depending on which animals students wanted to include. I advised them to put in a least two from each biome.
Students should be able to navigate the controls fairly easily, as they fill out the chart in the worksheet. The google doc can be shared on google classroom (make a copy for each student) and students can submit it that way. It could also be printed from either the pdf or the doc.
I made another version of this for my freshman that has a little bit more guidance and fewer questions to answer. It was designed for remote instruction so the text fields are colored for students to type in their answers and share on Google Classroom.
Biome Viewer
HS-LS2-2 Use mathematical representations to support and revise explanations based on evidence about factors affecting biodiversity and populations in ecosystems of different scales.